When you get towards the end of a market cycle a couple of things start to happen. Stock valuations increase, sentiment becomes extremely optimistic, expectations grow ever higher, and leveraged up investors push risk for return.
A “healthy correction” is one that provides a reset to some of those conditions (within the context of a resilient economic/fundamental undercurrent).
We’ve seen stock market valuations reset somewhat, likewise sentiment, but as I show below, leverage has not really reset, and if anything some investors are even doubling down…
The key takeaways on US stock market leverage are:
- Stock market leverage has undergone only a very minor reset through the correction, and remains near record highs.
- Margin debt growth is decelerating, but not at an alarming pace.
- Within the ETF market, leverage has actually increased.
If the bull market continues, as I believe it will, then the build up in leverage will only continue, meaning the eventual unwind will be all the more violent.
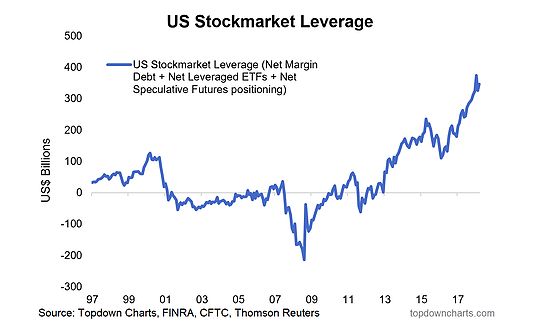
1. Total Net Stock Market Leverage: This chart is a favorite of mine, it tracks US stock market net-leverage aggregated across margin lending, leveraged equity ETFs, and speculative futures positioning. On all 3 counts US stock market leverage remains very close to the highs. With the dream run of low volatility and constantly rising stock prices of last year it is perhaps understandable that punters have pushed risk to drive a bit of extra return.
But it is also a vulnerability, because leverage can evaporate very quickly. There remains a vocal minority of perma-bears out there, but the silent majority are still on board – and my impression is that everyone thinks they will be the first to get out when things really do turn. This is an issue which has been weighing on my mind somewhat – it’s a line of thinking that works fine for any single individual portfolio manager, but if carried to universality it creates scope for price cascades.
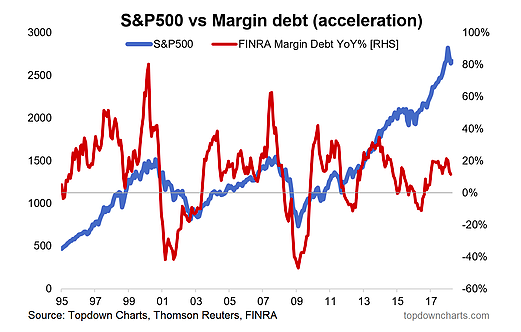
2. Margin Debt Acceleration: Zeroing in on margin debt, it’s one thing to look at absolute nominal levels, it’s another thing to look at deflated or percentage-of-market-cap indicators, and it’s another thing again to look at the rate of change, which is featured in the graph below. It turns out that the rate of change in margin debt – what I call margin debt acceleration (or deceleration depending on the market regime) – does a good job of turning a ‘wow-inducing’ chart into a practical tactical tool.
The situations to be vigilant of are excessive acceleration (which is something we did not see this time around – compare and contrast to 2000, and 2007), or excessive deceleration. What we can say about the chart is that the indicator has rolled over, and is decelerating – but not excessively. So at this point there are no bear market signals being sounded on here at the moment.
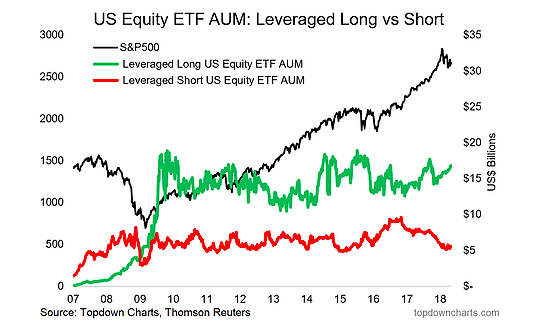
3. Leveraged ETF AUM: The final chart for this article is a look at leveraged-long and leveraged-short US equity ETF AUM (Assets Under Management). What I find interesting about this chart is that since the correction got underway we have actually seen AUM decline in short or ‘inverse’ ETFs, and rise for leveraged longs… so on “net” terms, ETF punters have actually leveraged up. Forget “BTFD”, this is GLLTFD (Get Leveraged-Long The… Dip).
To close out, I will say this. I was looking for a reset in several extremes through this correction, and I got that in valuations as the forward PE saw a solid reset, I also got it in sentiment as confidence pulled back sharply. But where it hasn’t really happened is with leverage. And if anything, some investors seem to be actually doubling down and leveraging up even more. I don’t think the bull market is over yet, and if I’m right about that, then the build up in leverage probably isn’t over yet either!
Twitter: @Callum_Thomas
Any opinions expressed herein are solely those of the author, and do not in any way represent the views or opinions of any other person or entity.
: Creating Bullish Divergence?")


 and Semiconductors (SMH): Concerning Price Pattern?")


