Last week’s post looked at a weekly volume-based breadth indicator.
With June in the history books, it is a good time to review the message from monthly breadth charts.
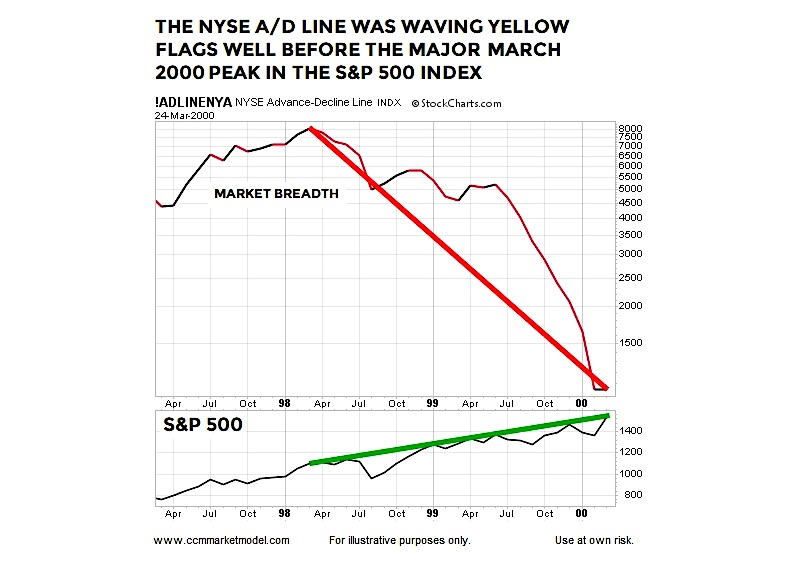
As shown below, the monthly NYSE Advance-Decline Line peaked in 1998 and thus was saying “pay closer attention” well before the S&P 500 Index (INDEXSP: .INX) peaked in March 2000.
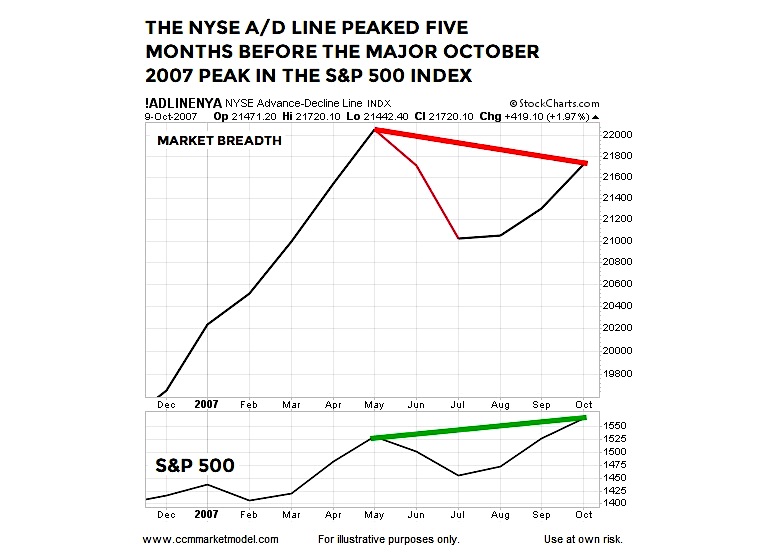
DIVERGENCE IN OCTOBER 2007
While not as pronounced as the 2000 example, monthly NYSE advancing issues less declining issues was showing a multiple-month divergence when the S&P 500 peaked in October 2007.
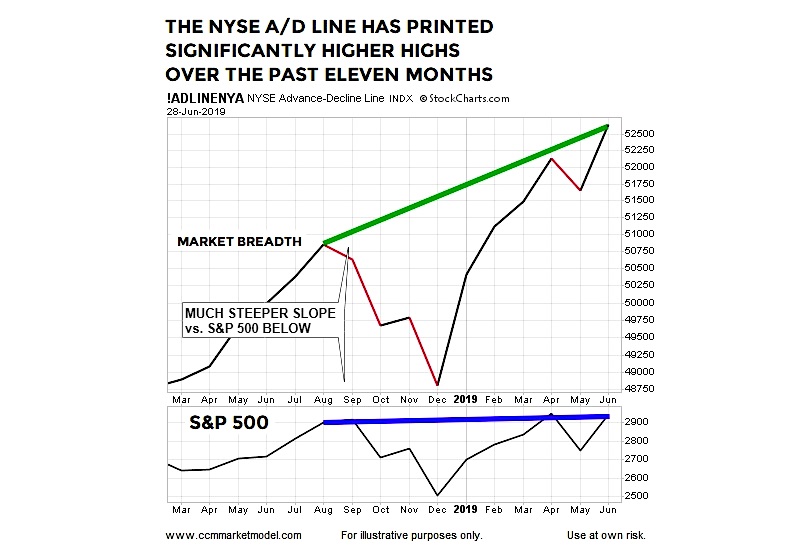
HOW DOES THE SAME MONTHLY CHART LOOK TODAY?
You can make an argument the present day version of the same chart has a bullish slant. Rather than the negative divergences that were in place before the S&P 500 peaked in 2000 and 2007, the 2019 monthly NYSE Advance-Decline Line has printed convincing higher highs.
DO THE FACTS SUPPORT THE BEARISH CASE FOR STOCKS AND THE ECONOMY?
This week’s stock market video covers a wide range of fundamental and technical topics, including a close examination of the Chicago Fed National Financial Conditions Index. Comparing current conditions to those present before big stock market drops in 1973, 1987, 1990, 2000, 2007, and 2011 provides historical insight into the risk versus reward trade-offs in July 2019.
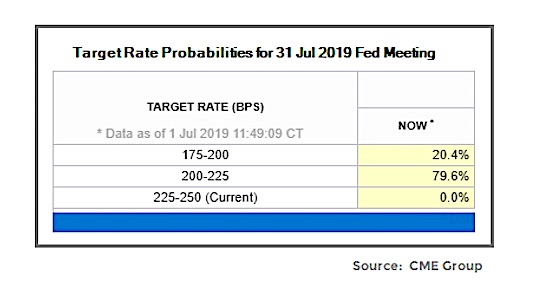
MARKET EXPECTING RATE CUT THIS MONTH
The June 14 video made the case the economy remains in expansion mode and demonstrated good things tended to happen in the S&P 500 after a first rate cut in a non-recessionary environment.
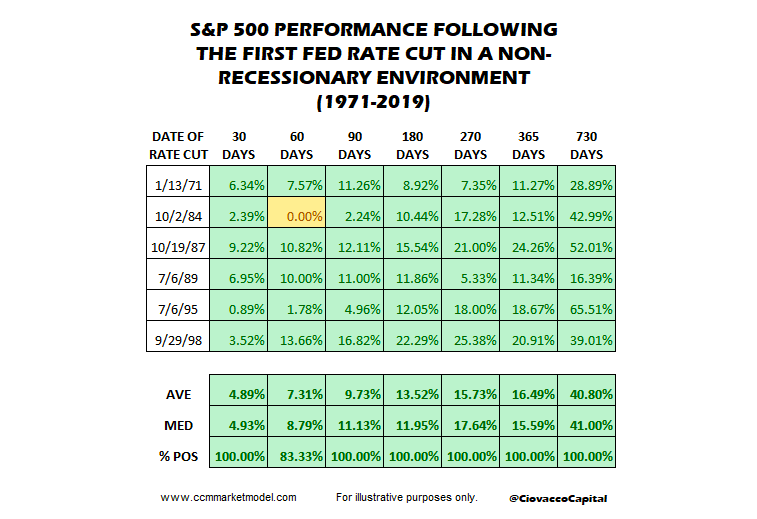
During Monday’s session, CME’s FedWatch Tool was showing a 100% probability of at least a 25 basis point rate cut on July 31.
THE WEIGHT OF THE EVIDENCE
There is nothing magical about market breadth when viewed in isolation; it is simply one component making up the weight of the evidence. Therefore, it is important we continue to review incoming information with an open mind about all outcomes, from wildly bullish to wildly bearish.
Twitter: @CiovaccoCapital
The author or his clients may hold positions in mentioned securities at the time of publication. Any opinions expressed herein are solely those of the author, and do not in any way represent the views or opinions of any other person or entity.


