Yesterday we wrote about the Nasdaq Composite (INDEXNASDAQ:.IXIC) springing the bull breakout trap and today we’re seeing major indices dance around slightly red on the day struggling to put together a follow through day to the downside.
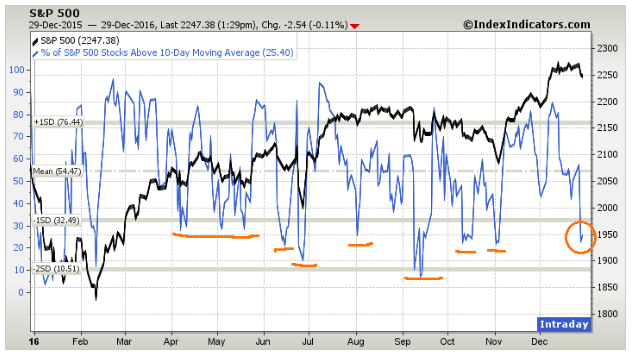
One market breadth indicator I like to use to determine how frothy we are to the up or downside is the % of stocks above a moving average, in this case the 10SMA (see chart below) – using the S&P 500 (INDEXSP:.INX) universe of stocks.
Note we’ve unwound the overbought readings from early December and are now seeing a reading of about 25% of stocks in the S&P 500 above the 10 day moving average.
Looking left, we can see this type of reading generally coincides with bounces in the market shortly thereafter.
Does it mean we have to bounce today? Of course not, its simply a way to add additional market context to your strategy or framework.
The more we sell off in the near term, the more interested I would be in looking for a reversal to buy.
I hope these setups give you some ideas for next week. You can check out more of my work at The Trade Risk. Good luck out there and thanks for reading.
Twitter: @EvanMedeiros
The author does not have a position in any mentioned securities at the time of publication. Any opinions expressed herein are solely those of the author, and do not in any way represent the views or opinions of any other person or entity.


