Bears are present in every market, even during strong bull markets.
Bull markets end when the net aggregate opinion of all market participants flips from bullish to bearish.
There are many ways to monitor the market’s net aggregate opinion, including studying asset class behavior.
When major market peaks occur, common economic sense tells us conviction shifts from owning growth-oriented assets to defensive-oriented assets, which is exactly what happened during the peaking process in 2007-2008.
The S&P 500 (NYSEARCA: SPY) peaked on October 9, 2007. The chart below shows a one-year period 200 calendar days after the major peak. The conviction shift that took place in 2007-2008 is evident in the market’s preference for defensive gold (GLD) and bonds (TLT) over growth-oriented stocks (SPY).
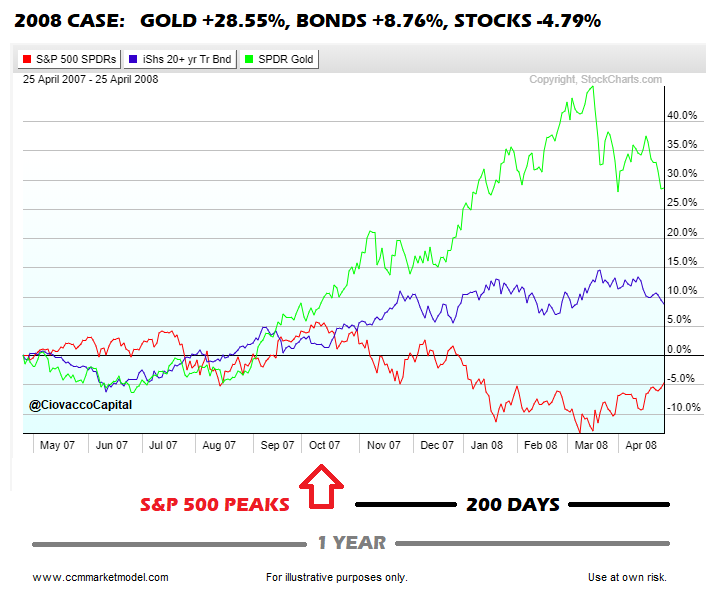
During the one-year period above, that includes the S&P 500’s October 2007 peak, gold gained 28.55%, bonds tacked on 8.76%, and the S&P 500 lost 4.79%.
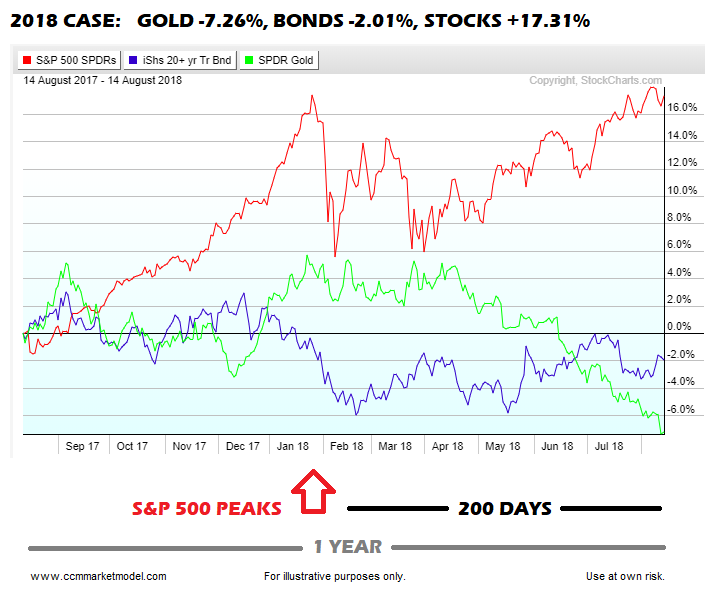
How Does the Same Graph Look In 2018?
The answer is nothing like the 2007-2008 case. The S&P 500 peaked on January 26, 2018. August 14 was 200 calendar days from the peak. If we look back one year, as we did in the 2007-2008 case, we see much different results from a tolerance-for-risk perspective.
Instead of gold being the number one performer, gold shed 7.26% over the past year. Bonds have dropped 2.01%. In the 2007-2008 case, the S&P 500 lost 4.79%. In the 2018 case, the S&P 500 has gained 17.31%.
Facts vs. Forecasting
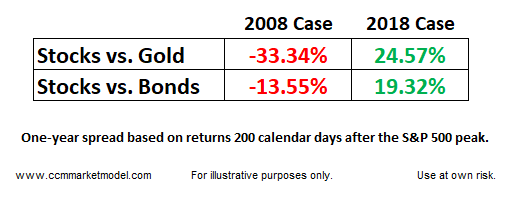
Is it possible gold and bonds begin to see a serious pick up in the conviction to buy category? Yes, but it has not happened yet. The table below shows the stock-bond and stock-gold performance spreads in the 2007-2008 case and the 2017-2018 case. The disparity in the data says a lot about the market’s tolerance for risk in 2018 relative to 2008, which in turn says a lot about the market’s perception of the long-term fundamentals in 2018 relative to 2008.
Asset class behavior aligns with numerous forms of longer-term evidence, including the S&P 500’s long-term trend, that still point to favorable odds for stocks in coming weeks, months, and years.
Twitter: @CiovaccoCapital
The author or his clients may hold positions in mentioned securities at the time of publication. Any opinions expressed herein are solely those of the author, and do not in any way represent the views or opinions of any other person or entity.


