RECENT SIGNAL SEEN NEAR 2002 AND 2009 STOCK MARKET LOWS
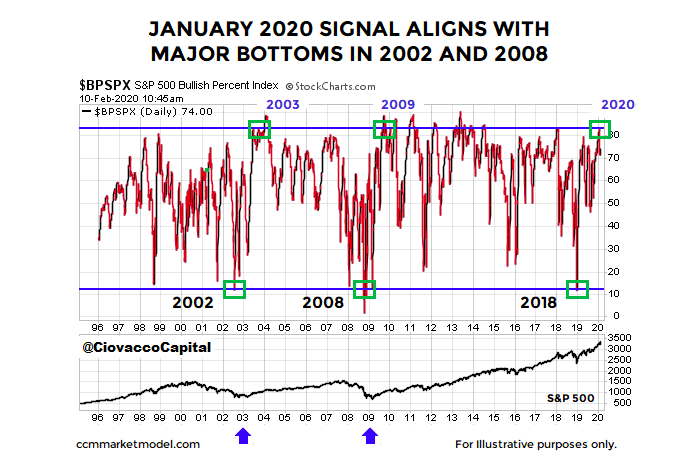
As shown in the chart below, the S&P 500 Bullish Percent Index (BPSPX) recently completed a bullish turn that has only taken place two previous times since 1996.
In late December 2018, BPSPX reached a rare oversold state denoted by the lower blue horizontal line.
A significant shift in the perception of future economic and market outcomes pushed BPSPX all the way back to 83% on January 17, 2020.
The two previous signals were completed in 2003 and 2009 (reaching upper blue line).
HOW DID STOCKS PERFORM IN PREVIOUS CASES?
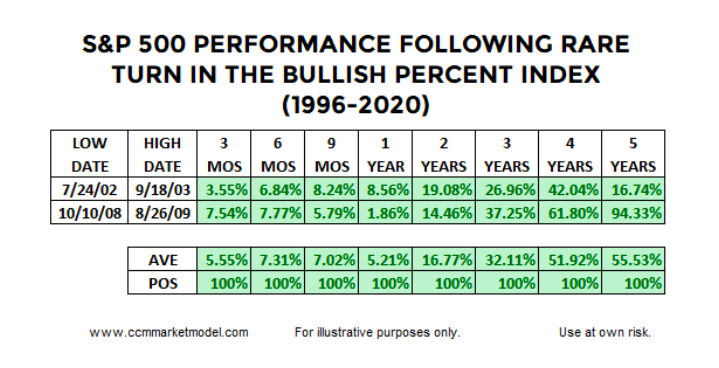
The answer to the question above is quite well from a long-term perspective.
Notice the S&P 500 makes very little progress in the six-month to one-year window, telling us to keep an open mind about normal pullbacks and corrections. The signal above speaks to the long-term outlook as evidenced by the average gain of 51.92% looking out four years from the date of the signals (high date in table below).
THE MOST IMPORTANT INVESTING AND STOCK MARKET VIDEO THAT YOU WILL EVER WATCH
One of the most important things in investing and trading is to understand a wide range of outcomes, from wildly bullish to wildly bearish. This week’s video tests six bearish concepts using historical data, allowing us to have a more accurate perspective of how markets operate in the real world.
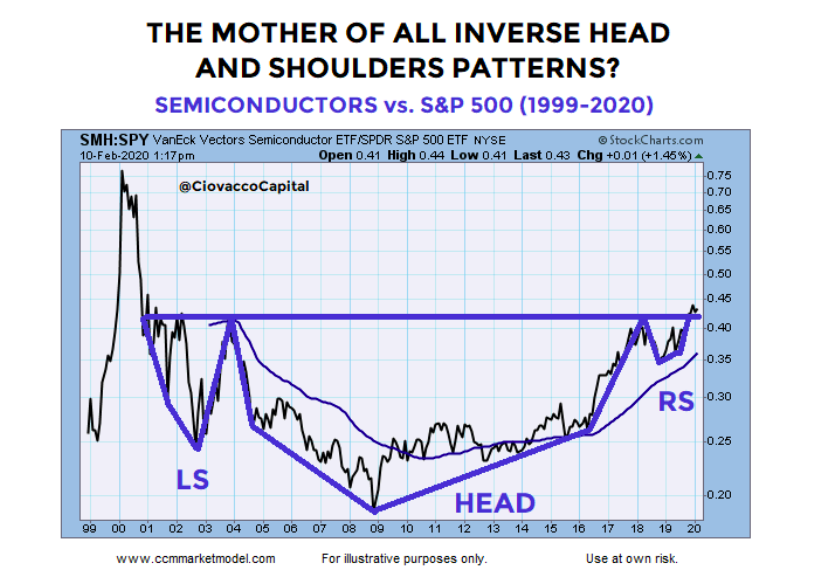
THIS CHART SAYS A LOT ABOUT ECONOMIC EXPECTATIONS
Semiconductors are used in a wide variety of ways throughout the global economy, including in TVs, phones, computers, and automobiles. Therefore, we can gain insight into the market’s expectations regarding future economic outcomes by monitoring the performance of semiconductor stocks (SMH) relative to the S&P 500 (SPY).
DAY BY DAY WITH REALISTIC EXPECTATIONS
It is easy to review a long-term bullish study and expect the market to be green every day, every week, and every month. We all know the S&P 500 experienced a ton of scary volatility between the October 2002 low and October 2007 high, which serves as a valuable reality check even if good things happen for a long period of time walking forward in 2020.
Our approach assesses probabilities based on the facts in hand. If the facts change in a bearish manner, we must be flexible enough to reassess the odds. The charts and facts have been helpful numerous times since the December 2018 low. See prior articles here.
Twitter: @CiovaccoCapital
The author or his clients may hold positions in mentioned securities at the time of publication. Any opinions expressed herein are solely those of the author, and do not in any way represent the views or opinions of any other person or entity.


