Not much has changed in the markets over the past several weeks. Stock market bulls continue to make money, while the S&P 500 continues to hold above 2100 and just under a major Fibonacci resistance level around 2140.
Janet Yellen is on tap Wednesday as the Fed lays their cards on the table and highlights their economic projections. Market sentiment around the Fed is bifurcated and bulls and bears have dug in. There are brilliant market minds convinced the Fed won’t back down from their easy money stance and similar brilliant minds on the other side of the fence that are sure that the writing is on the wall for a rate hike. Yellen appears to understand that they need to raise rates while they can..Draghi and Abe on the other hand…
Check out my favorite reads of the week in my “Top Trading Links” post this week.
MACRO VIEW
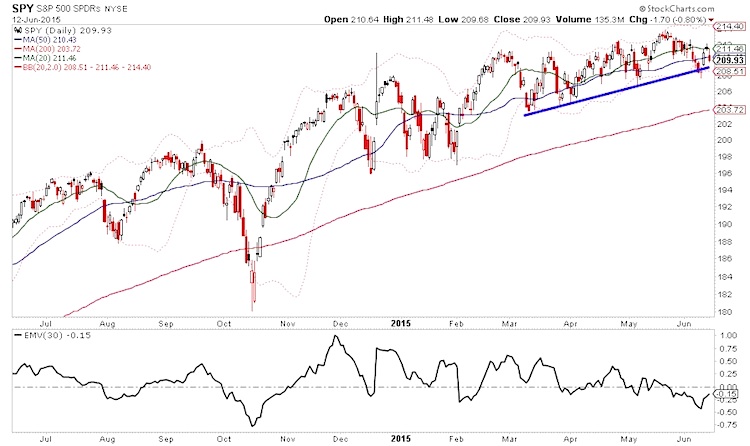
Investors could make an argument that resistance is strengthening in the S&P 500, as the ease of movement index is tracking lower. Also, the 4 month rising support line has been tested and should be a good “tell” for traders (and the broader stock market) over the near-term.
S&P 500 ETF (SPY) Chart
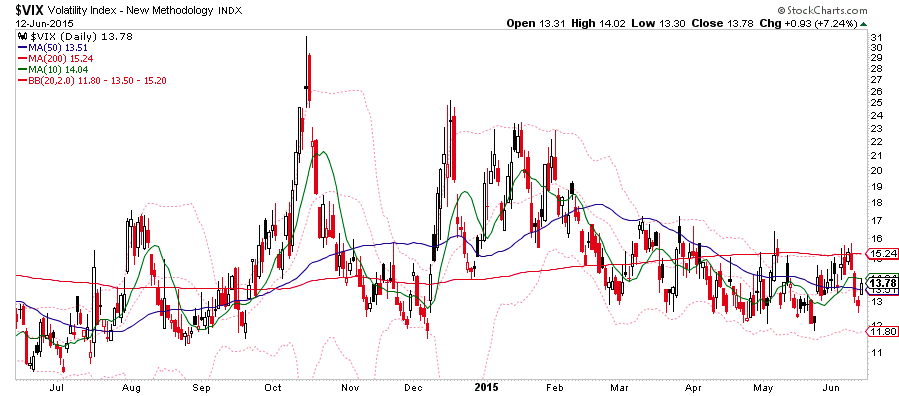
The Volatility Index (VIX) ended the week by testing the 10 day moving average from below – next week’s action could be telling..
Volatility Index (VIX) Chart
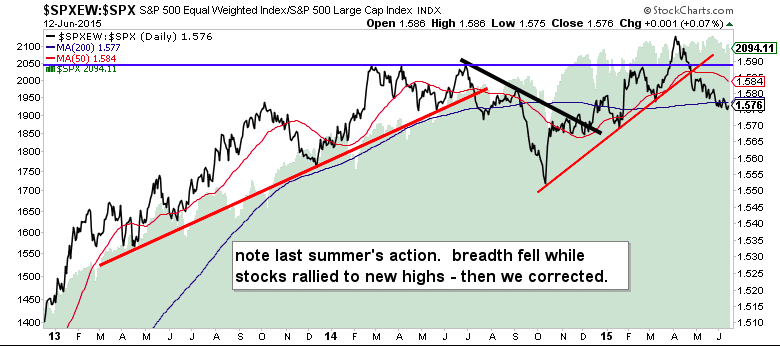
Market breadth is still disgusting, even within the S&P 500 (SPX). Check out the Equal-Weighted Index relative to the SPX.
MARKET SECTORS
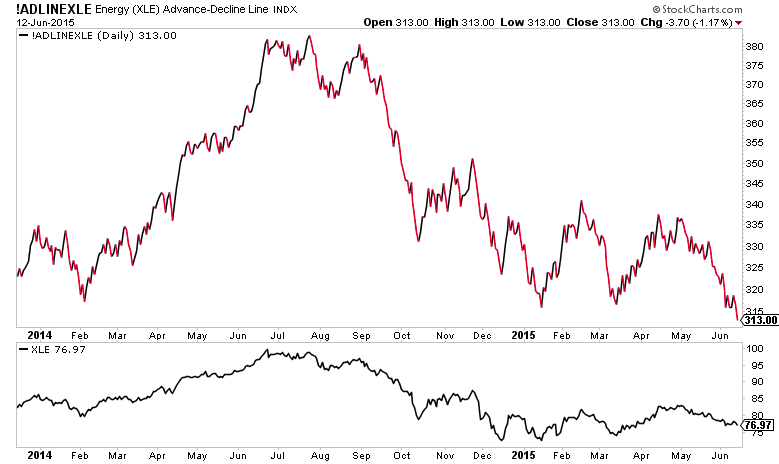
The Advance/Decline line for the Energy Sector ETF (XLE) hit new lows. The best way to describe this action is that price is masking the underlying damage.
Energy Sector ETF (XLE) “Breadth” Chart
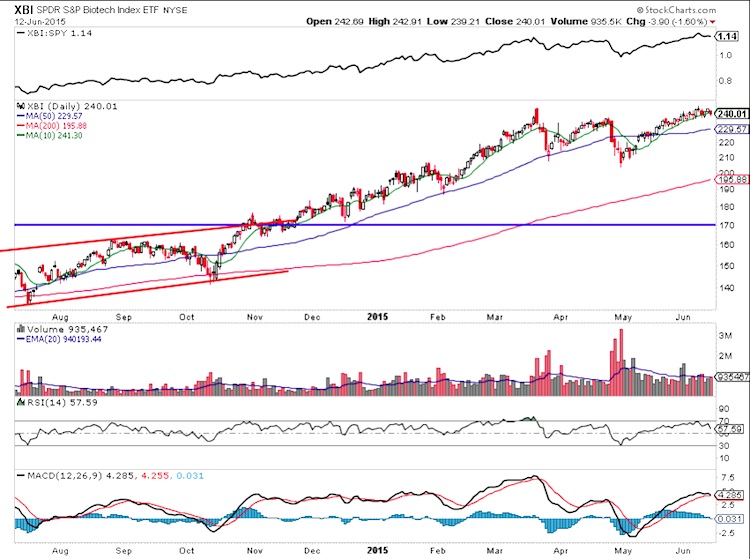
The SPDR Biotech Sector ETF (XBI) continues to trade in a tight range. It looks like a “rollover” type of setup to me.
Biotech Sector ETF (XBI) Chart
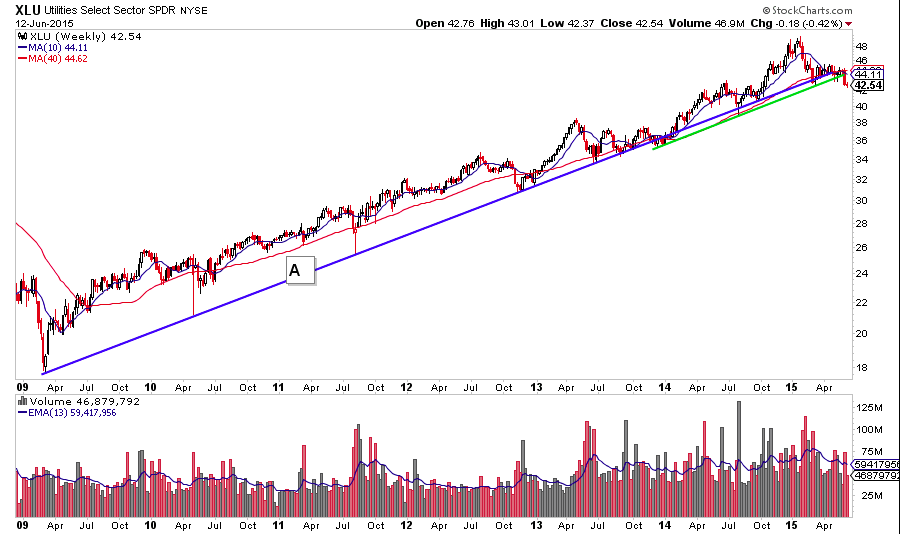
It’s worth repeating that Utilities Sector (XLU) has broken its long term trend line.
Utilities ETF (XLU) Chart
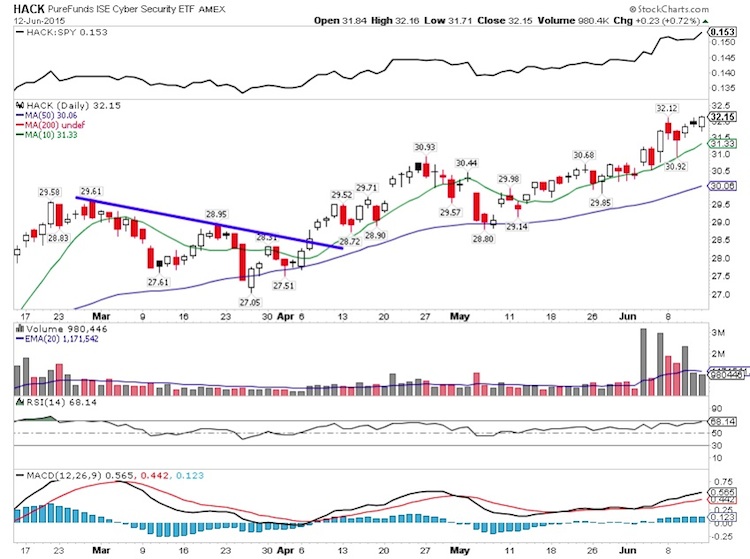
Cyber Security stocks (via the ETF – HACK) flashed major relative strength on Friday. This sector has been a beautiful group in 2015.
Cyber Security ETF (HACK) Chart
Despite the lackluster price action on the major stock market indices (and weakening market breadth), there are good setups in select stocks and sectors. Sometimes you just have to work a little harder to find them! Thanks for reading and trade em well next week.
Twitter: @ATMcharts
Read more from Aaron on his blog.
No position in any of the mentioned securities at the time of publication. Any opinions expressed herein are solely those of the author, and do not in any way represent the views or opinions of any other person or entity.
: Creating Bullish Divergence?")


 and Semiconductors (SMH): Concerning Price Pattern?")


