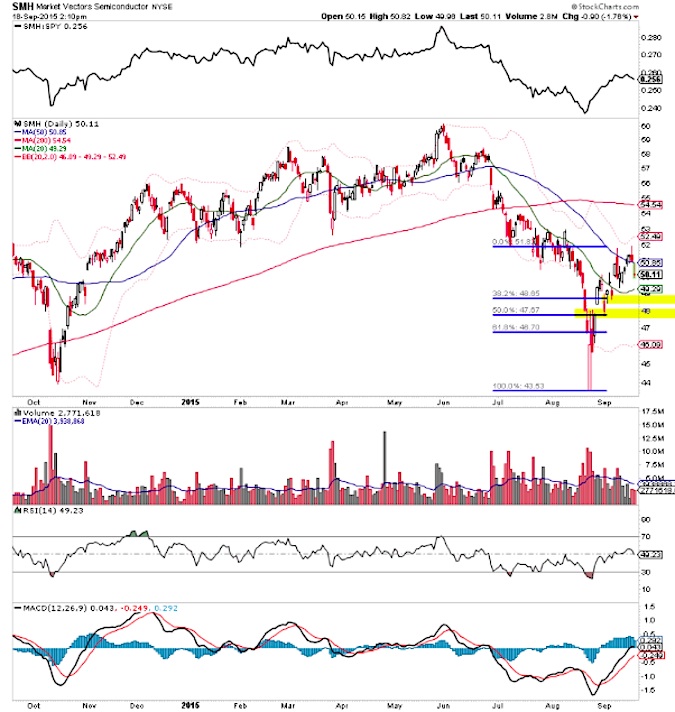
My main price target area is the high 47s in the Semiconductor ETF (SMH). A little bit lower, the 46 level stands out.
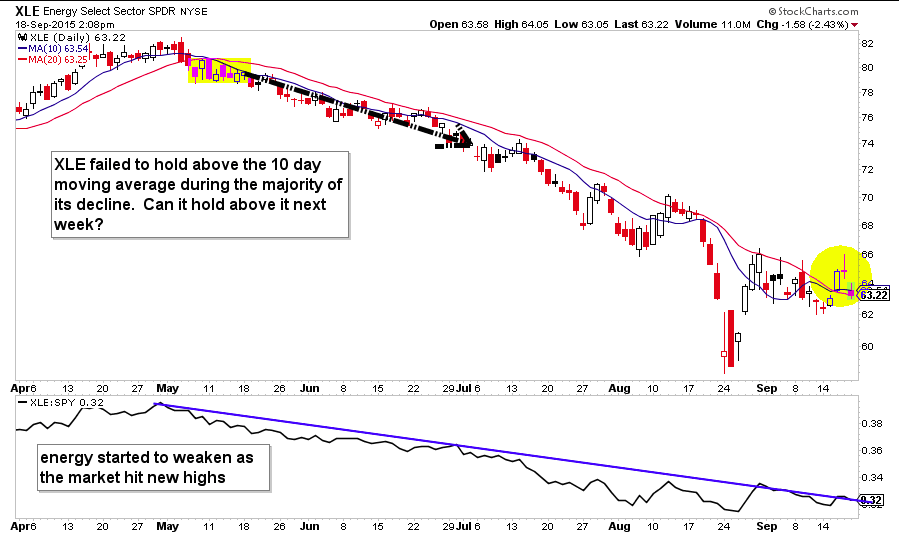
Can the Energy ETF (XLE) hold above the short term moving averages? It doesn’t appear so, but this is the best effort energy stocks have had in five months.
Thanks for reading.
Read more from Aaron on his blog.
Twitter: @ATMcharts
Any opinions expressed herein are solely those of the author, and do not in any way represent the views or opinions of any other person or entity.


