S&P 500 futures continued to move upward from yesterday’s premarket move to breach a key S&P 500 resistance level and move into targets set earlier in the blog spreadsheets – this morning it tested 2068. This new area is attempting to hold as new support. The moving averages of interest are located down at the 2055 region so that should be a larger magnet support if S&P 500 futures lose 2065.
It should retest this area around 2055. And if buyers hold, we’ll bounce and see higher levels.
Intraday S&P 500 resistance sits near 2073.5. Intraday support sits at 2065. Breaks of either support or resistance must be confirmed for trending trades on the day to hold. We have a bullish momentum formation in the shorter cycles and time frames of the charts that suggests minor pullbacks into higher support. Volume is lighter due to the holidays so trading may feel choppy.
Shorter time frame momentum indicators are positive, and higher than Tuesday. Longer cycles are upward trending and holding in positive territory.
See today’s economic calendar with a rundown of releases.
RANGE OF TUESDAY’S MOTION
Crude Oil Futures (CL_F)
Oil expanded aggressively into 37.9 before beginning a fade that continues this morning. It seems clear that there are groups of sellers around 37.89. Support still looks like 36.4 – 36.6. Momentum is mixed. Bigger picture still suggests a basing formation but the EIA report may shift the delicate balance of motion if it comes in as a surprise in either direction.
A squeezing action shows on the 4hr time frame. With mixed motion, it is very likely that breach in either direction will be retraced. Intraday trade setup suggests a long off 36.9 bounce into 37.2, 37.4, 37.7 and perhaps even more if the buyers take over – see the blog for levels above that region. Below a 36.7 failed retest or a rejection of the 37.3 area sends us to 37.06, 36.87, 36.7, 36.53, and 36.35. Momentum on longer time frames is mixed and holding.
E-mini S&P 500 Futures (ES_F)
Below is a new chart with active S&P 500 futures price support and resistance trading levels. Click to enlarge.
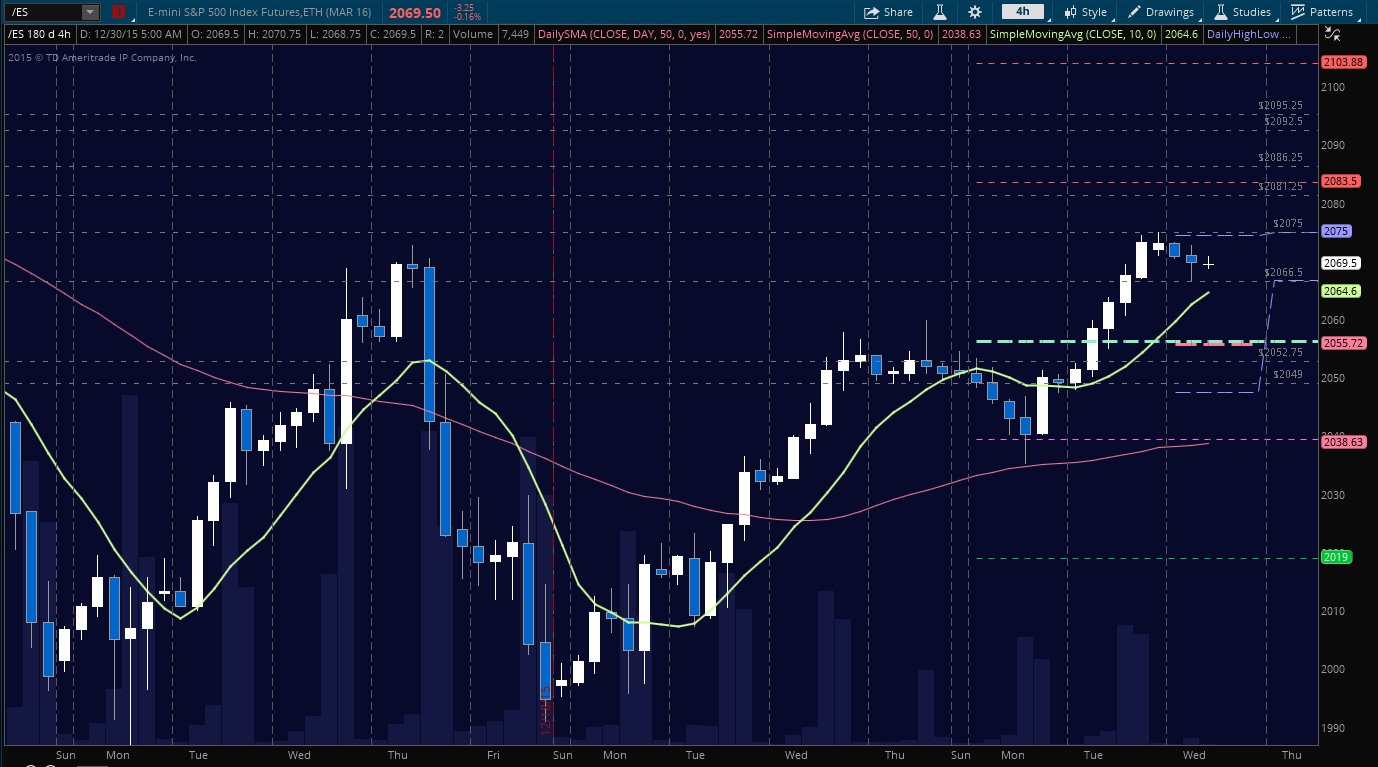
Upside motion is best setup on the bounce off 2068– or a breach of 2075 (as long as momentum is holding). A bounce off 2055.5 would make the deepest long setup after a retrace into support with targets near 2060, and 2068, but watch 2068 for sellers to try to reverse the trend. The breach of 2068 will likely advance buyers and bring more upside into S&P 500 resistance (futures) above at 2073.5, 2075, 2079.75, 2083.5 and 2086.25. Long trades are trending today.
Downside motion below the failed retest of 2075 (with negative momentum), or at the failure to hold 2066.5 opens the short. Retracement into lower levels from 2075 gives us the targets at 2071.5, 2068, 2065.75, 2060.5, 2057.75, and perhaps 2054.5.
Short action intraday is countertrend currently unless we have a failure and failed retest of 2075 with momentum shifts. 2054-2051 remains a line in the sand for value buyers to step into the chart at this time.
If you’re interested in the live trading room, it is now primarily futures content, though we do track heavily traded stocks and their likely daily trajectories as well – we begin at 9am with a morning report and likely chart movements along with trade setups for the day. You can visit The Trading Vault to learn how to trade the way I do.
As long as traders are aware of support and resistance levels, risk can be very adequately managed to play in either direction. Thanks for reading.
Twitter: @AnneMarieTrades
The author trades futures every day and may have a position in mentioned securities at the time of publication. Any opinions expressed herein are solely those of the author, and do not in any way represent the views or opinions of any other person or entity.


