The disconnect between Fed tightening and the rebound in the tech sector leaves many investors wondering what will happen next.
The Fed is raising interest rates, which is frequently a precursor to a stock market decline, but growth stocks are rallying.
The S&P 500 has regained some of its losses and is now only down 16.5% year to date.
Crypto assets have also been recovering.
At Marktgauge, we utilize our proprietary market signals to support our trading.
It is also always essential to stay informed, trade the market in front of you, and keep a wide range of trading and market outcomes as possibilities.
Year after year, I have significantly outperformed the S&P 500, helping countless investors generate returns that beat the indices with our proprietary trading signals combined with disciplined risk management.
We like to invest in solid sectors, leading companies, and growing industries.
We begin by looking at these ETFs daily to simplify and model daily market dynamics, and then will dive deeper into specific areas.
To be a successful investor, you need to have an investment plan that outlines your goals, risk tolerance, and how you will mitigate risk.
As a rule of thumb, tilting your portfolio towards the strength of the market that is outperforming is one of the first steps towards investment success.
The state of the ‘modern family’ is a good indicator of the strength of different economic sectors.
My “Economic Modern Family” is a guide to understanding how different sectors are performing and how that impacts the economy and the overall stock market.
This family smart group consists of one index and 6 sector ETFs to help you understand what is happening in the market and how you should react.
The seven indices in the Modern Family are:
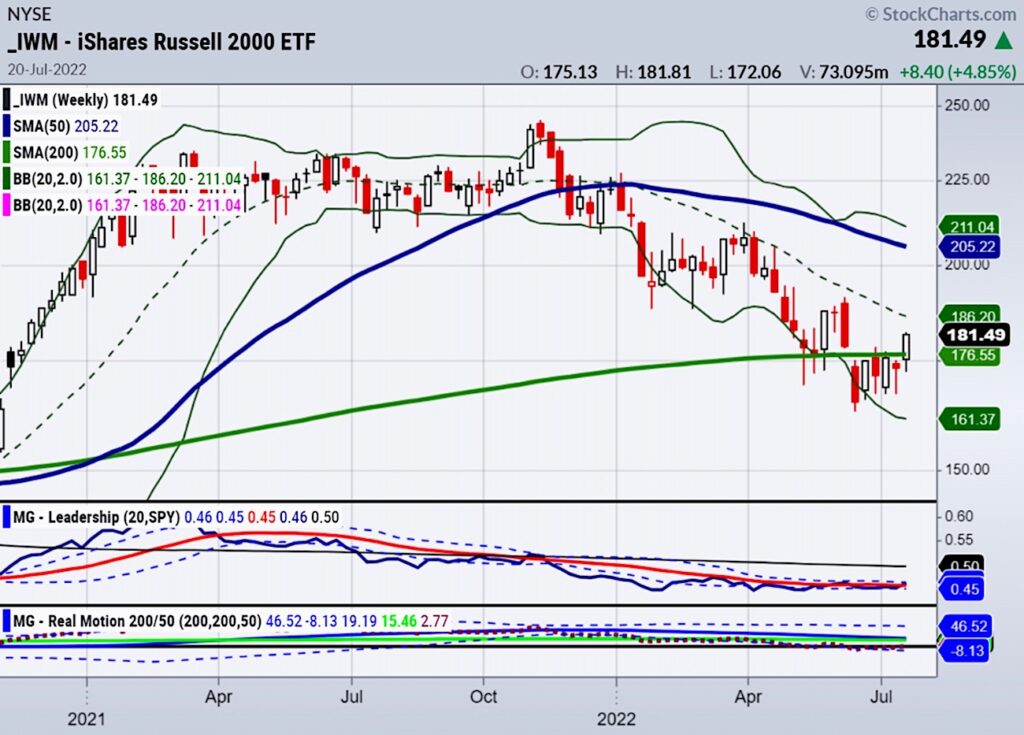
- Russell 2000 (IWM) “Grandpa”
- Retail sector (XRT) “Grandma”
- Regional Banks (KRE) “Prodigal Son”
- Biotechnology (IBB) “Big Brother” – Biotech,
- Semiconductors (SMH) “Sister” –
- Transportation (IYT) is called such because he/she is ever changeable. A reliable measure of the supply versus demand,
- Crypto-Bitcoin as lead indicator.
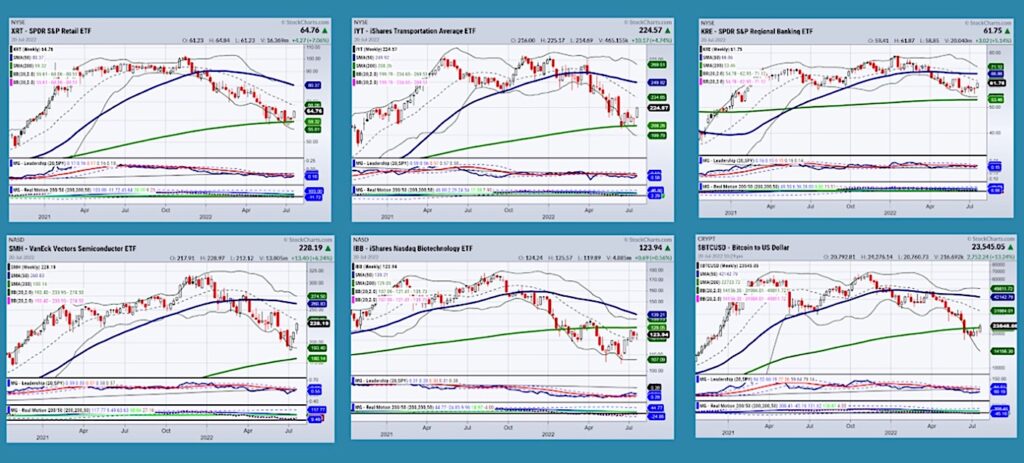
Currently, biotech and semiconductors look strong.
However everyone on the family is happy in its now recuperation phase.
We recommend watching Granny Retail (XRT) particularly. If the discretionary consumer sector stays strong, that is the most compelling reason we can think of that might push the SPY to 420.
A tactical sector rotation can provide opportunities in a changing macro landscape. By tracking these ETFs, it’s possible to get a clearer picture of where the market is heading and how to position your portfolio.
Stock Market ETFs Trading Analysis & Summary:
S&P 500 (SPY) Confirmed Recuperation Phase. 50-DMA line in the sand.
Russell 2000 (IWM) Like SPY confirmed must hold the 50-DMA
Dow Jones Industrials (DIA) 315 support. Also confirmed
Nasdaq (QQQ) confirmed and leading
KRE (Regional Banks) 60.00 support
SMH (Semiconductors) Into some resistance but also strongly confirmed phase change
IYT (Transportation) 220 support along with the 50-DMA
IBB (Biotechnology) 129.50 resistance
XRT (Retail) 65 resistance so we want to see Granny continue to hold up.
Twitter: @marketminute
The author may have a position in mentioned securities at the time of publication. Any opinions expressed herein are solely those of the author and do not represent the views or opinions of any other person or entity.


 Ready To Break Out?")


")