The Gap (GPS) traded 12% lower on Friday morning, after reporting earnings that missed Wall Street expectations.
The company reported earnings per share of $0.42 and total revenue of $3.8 billion, compared to estimates of $0.46 and $3.6 billion.
Their guidance for FY19 remains unchanged at $2.55-2.70, which is in line with the estimates of $2.62. Yet same store sales came in at only 1%, compared to estimates of 1.7% and 2% for the same quarter a year ago.
Shares of the Gap (GPS) Likely to Head Lower Yet
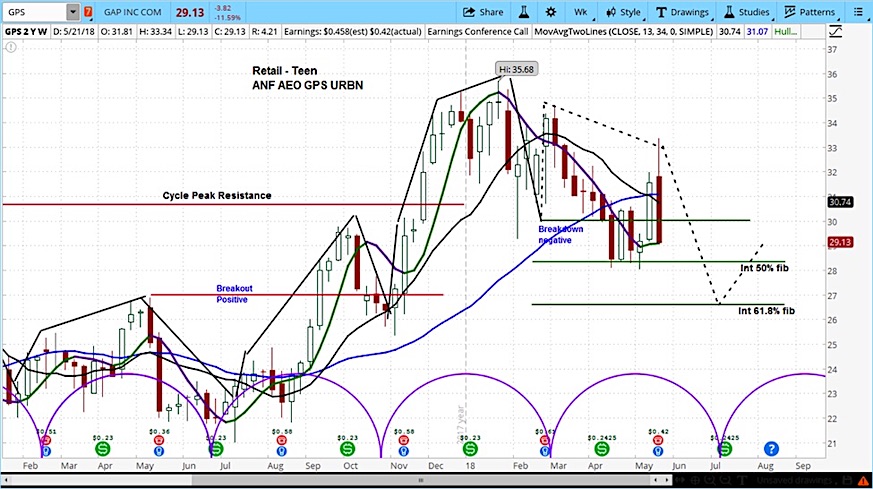
In reviewing the market cycles on the GPS chart below, we can see that they actually “dropped their drawers” in April when the stock broke the low at which it began its current cycle.
As such, we expect to see continued downward pressure on the stock price until the conclusion of the cycle in July. Our target $26.50.
The Gap (GPS) Stock Chart with Weekly Bars
For an introduction to cycle analysis, check out our Stock Market Cycles video.
Twitter: @askslim
Any opinions expressed herein are solely those of the author, and do not in any way represent the views or opinions of any other person or entity.


