The Echoing Conundrum
“With the Federal Reserve (Fed) conducting their regularly scheduled FOMC meeting this Wednesday, we point out an interesting contrast between the current posture of the Fed which suggests they are leaning toward Fed Funds rate hikes versus prior post-crisis policy”. – Interest Rate Policy Conundrum – March 17, 2015
720 Global penned those words 6 months ago to describe the conundrum inherent in the Federal Reserve (Fed) monetary policy deliberations. Today, the situation is still the same as the Fed is considering raising interest rates against a backdrop of feeble economic growth and weak inflation data at its September 16 meeting. The prior article highlighted how economic activity, economic expectations and inflation at the time were at similar or lower levels then when the Fed initiated QE2, QE3 and Operation Twist. In this article, those data points are updated, and new charts and commentary are provided. This article concludes with a reminder of how poor market and Fed predictions have been regarding interest rate increases since the financial crisis.
The facts presented in this article may lead one to question the Fed’s comprehension of the debt dynamics restricting economic growth.
The 720 Global Proprietary U.S. Economic Trend Model
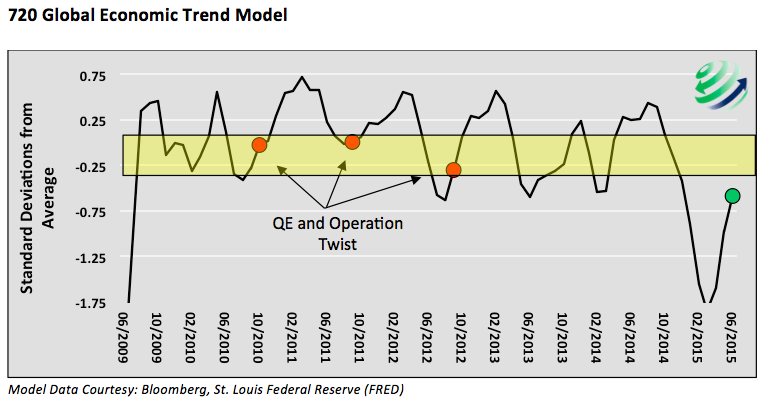
The 720 Global U.S. Economic Trend Model aggregates 8 key economic statistics comparing data from the prior 3 months to the average of the 6 months preceding those 3 months. As seen below, the model shows improvement since the results were first published 6 months ago. Despite the improving trend, the current level (green data point) indicates data is worse off today than when the Fed previously took steps to ease monetary policy as denoted by the red data points and the yellow shaded range. The recent improvement in economic trends is driven in part by a recovery from weak economic data witnessed in the first quarter of 2015. As time goes by and the poor data is removed as a model input, the results will stabilize or turn lower barring an unforeseen pickup in economic activity.
720 Global Economic Trend Model
Citi Economic Surprise Index
Similar to the output from the 720 Global model shown above, the Citi Economic Surprise Index has also risen recently as a result of a relative recovery from the economic slowdown in the first quarter. Citi’s index (graphed below) compares current economic indicators to Wall Street economists’ expectations. Like the 720 Global model, the current index level (green data point) resides at similar levels seen prior to the Fed’s actions to ease monetary policy. While the indicator has improved, it remains in negative territory implying current economic data is still falling short of expectations.
continue reading for more about inflation expectations and the Fed’s track record…

: Showing Some Signs of Emerging Strength")
