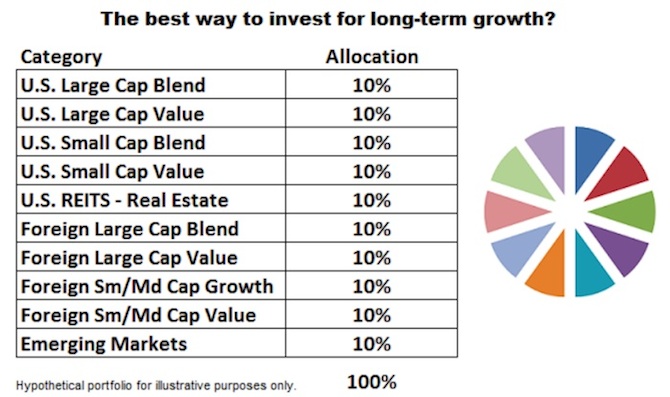
There are many different ways to invest, including using a strategy that involves portfolio diversification via ETFs and/or mutual funds. For example, we recently saw the investment allocation model (in the chart below) described as the best way to invest for long-term growth based on the best research and investment experience. But history says implementation and follow through are far from easy.
Intelligent Robots Build Pie Charts
Our purpose here is not to question the long-term performance of the allocation above, but rather to demonstrate the difficulty of staying invested during good times and bad times, a requirement to successfully capture the benefits of any buy-and-hold portfolio strategy. This topic is very timely with the recent rise of the “intelligent robot built portfolio”, which typically involves building a pie chart based on history, investing in the pie chart, holding the pie, and rebalancing the pie from time to time.
Key To Success Is Proper Implementation
History says buy-and-hold is a legitimate strategy. Our concern lies with investor knowledge relative to proper implementation of buy-and-hold from three perspectives:
- Stocks can literally go decades without making any progress.
- Successful buy-and-hold and rebalance requires that investors hold through a full market cycle (good and bad times).
- Buy-and-hold and rebalance allocations can get hammered in a bear market, making it very difficult to successfully implement the “hold” portion of the strategy.
Stocks Typically Zig And Zag In Unison
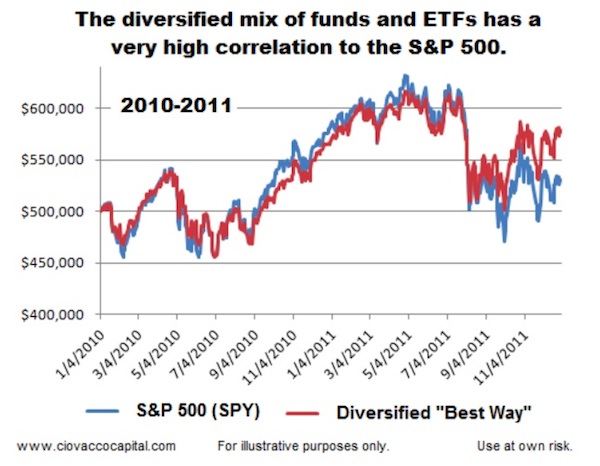
Assume we decide to use “the best way to invest for long-term growth” allocation above. The chart below demonstrates the “best way to invest” allocation for the most part goes up when the market goes up and goes down when the market goes down (it has a high correlation to the S&P 500). Therefore, the performance of the “best way to invest for long-term growth” portfolio will be heavily influenced by the performance of the major indexes (S&P 500, Dow, NASDAQ, etc). The same argument applies to the equity portion of any allocation, even one that includes bonds and portfolio diversification.
If Your Plan Requires Growth…
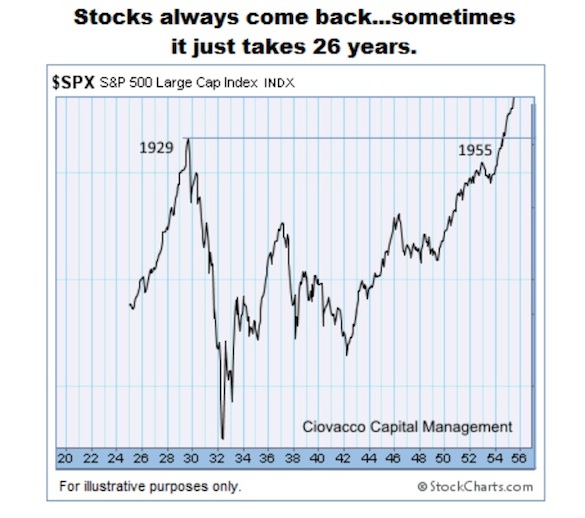
If my retirement game plan requires that I grow my capital, what does history tell us about dead periods for stocks? Assume we were 50 years old in 1929 and five to ten years away from retirement. If we invested in the stock market at age 50, we would have waited until we were 76 years old just to get back to break even. As shown in the chart below, it took 26 years for the market to get back to the same level it was in 1929.
The text below comes from a Forbes article written by Sy Harding:
“In the 1929 crash and its aftermath the market lost 86% of its value and did not get back to its 1929 level until 1955, twenty-six years later. That was 26 years of waiting for buy and hold investors (if there still were any) for the market to ‘come back’.
Well, That Was A Unique Period, Right?
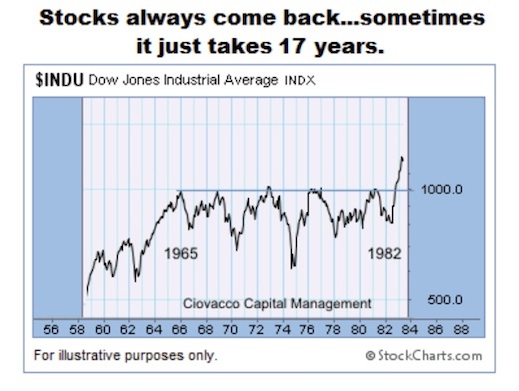
It is fair to say 1929 to 1955 was a unique period. Assume we were 55 years old in 1965 and five to ten years from retirement. If we invested in dividend-paying blue chips to grow our capital, we would have been very disappointed. As shown in the chart below, the Dow Jones Industrial Average hit 1000 in 1965 and did not exceed that level for any significant period of time until 17 years later in 1982. Therefore, the Dow made no progress between age 55 and age 72 for our hypothetical investor. The S&P 500 followed a similar path over the same period.
Sy Harding described the period this way – from Forbes:
“In 1965, just 11 years later, when the Dow reached 1,000 for the first time, the long 1965-1982 secular bear market began. For the next 17 years the Dow cycled between cyclical bull markets and cyclical bear markets, but did not manage to rise above its level of 1965 until late in 1982. It was another 17 years in which buy and hold investors (again if there were any left) waited for the market to come back. Seventeen years of whipsawing heartbreak for buy and hold investors, but wonderful opportunities for market-timing. That made a total of 41 of the 53 years between 1929 and 1982 that buy and hold investors were waiting and hoping for the market to get back to previous levels.”
The Modern Markets Are Different, Right?
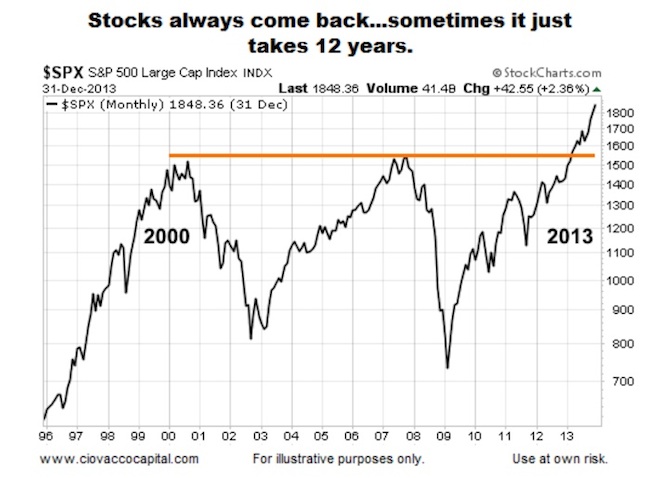
Since the whole premise of buy-and-hold and rebalance is based on historical returns and stock market history, it makes sense for a buy-and-hold investor to understand the more difficult periods in history. One might say: the market and economy are much different than they were in 1929 or 1956. Assume we were 58 years old in 2000 and five to seven years from retirement. Any investment related to stocks in our portfolio most likely made very little progress between age 58 and age 70, given the S&P 500 made no progress between 2000 and 2013.
If We Have To Hold, How Bad Can It Get?
Remember successful implementation of buy-and-hold and rebalance requires that we hold the mix of ETFs/mutual funds through the good times (bull market) and bad times (bear market). Therefore, to increase the odds of holding during the bad times a fair question is how bad can it get? This week’s stock market video examines the performance of the allocation below day-by-day during the financial crisis bear market (2007-2009), allowing an investor to understand what they might have to endure to capture the full cycle benefits of buy-and-hold and rebalance.
The video also shows the performance of a diversified portfolio of mutual funds during the dot-com bear market.
Thanks for reading and watching. Have a great rest of your week and weekend.
Read more from Chris on the CCM blog.
Twitter: @CiovaccoCapital.
Any opinions expressed herein are solely those of the author, and do not in any way represent the views or opinions of any other person or entity.


