Past Experience
In the current set of circumstances, the economy and markets are experiencing a confluence of shocks that are both extreme and unique. Regardless, we can still reflect on past episodes that caused great turmoil and anxiety. Although the analysis does not provide explicit answers, the rigor offers insight and direction.
As James Grant once said, “My goal is to have everyone agree with me, later.”
Foresight with confidence offers early, cheap entry into opportunities that everyone else sees “tomorrow”.
A New Trajectory for U.S. Growth
The chart below offers a substantive context for what has transpired over the past 40 years. The colored lines show what economic activity would have been had the growth rate of the prior expansion held true in the following expansion.
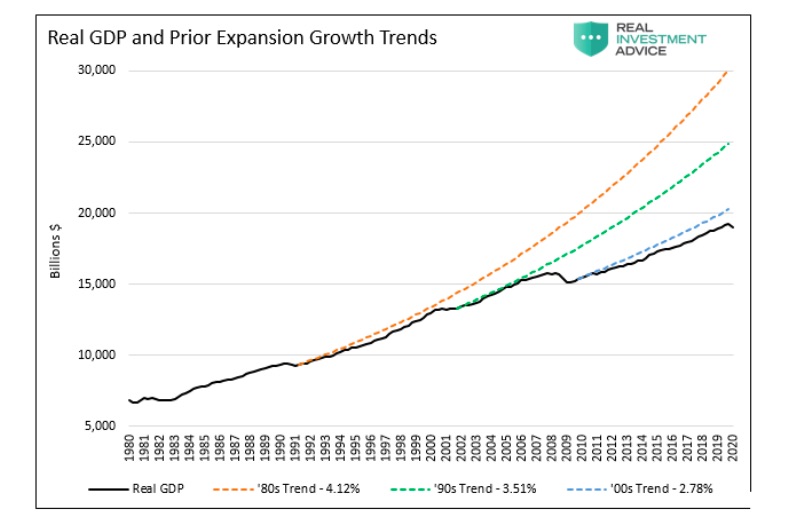
As shown, after each successive bubble, the trajectory of growth, GDP shifts lower. Slow economic growth implies that the time to full recovery is elongated.
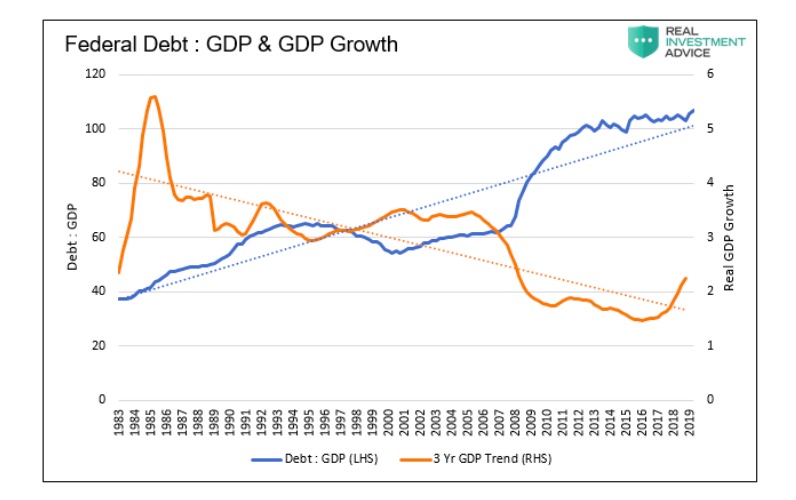
To predict a post-COVID growth trajectory we need only look at the ratio of Federal debt to GDP. As shown below, the trend lines of that ratio to trend economic growth are negatively correlated. Since 1990 the relationship has a very high r-square of .928. Simply, as the ratio of Federal debt to GDP rises, economic growth declines.
The next graph projects GDP based on the expected ratio of Federal Debt to GDP. For this exercise, we conservatively assume the ratio will be 115% when the economic recovery begins. That compares to 82% in 2009 and 55% in 2002. We also assume economic growth falls by 10% in the second quarter and 1% in the third quarter. GDP then grows at our projected growth rate of 1.07%.
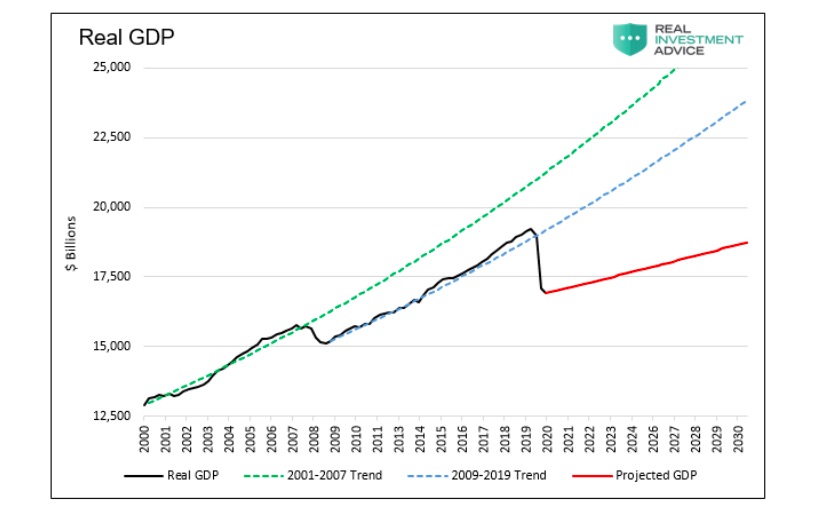
Based on this analysis, the economy will not regain pre-COVID economic levels this decade.
The Culprit
The new paradigm of weak recoveries is due to the Fed’s policy prescription for recessions; debt-fueled consumption. Through lower interest rates they incentivize people, corporations, and the government to borrow. The benefits are here and now as economic recovery ensues. The cost is paid tomorrow.
The debt is increasingly put to unproductive uses, and the obligations grow exponentially larger than income. As we discussed in Why the Recovery Will Fall Short of Forecasts, given the issues facing productivity and demography, this is a troubling outlook.
Recessions are a normal part of the economic cycle. They are a healthy reset that purges weak businesses and encourages productive capital investment for the future, not speculation. The resumption of growth takes time in a recession left to its course. However, improved productivity and prudent use of resources sets the economy on a sustainable path to healthy growth.
The New Order
Modern-day Fed policy encourages speculation over productivity growth. The result is sustained unemployment and low wage growth. The longer people are out of work, the less likely they are to re-assimilate into the productive workforce. This means they require and expect more government assistance, which further raises the debt obligation on the dwindling taxpayer.
Revisiting one of our cornerstone concepts, economic growth hinges upon two key elements:
- Growth in the labor force
- Productivity gains
The regressive trajectory of GDP growth reflects that those factors of growth are diminishing.
CONTINUE READING ON THE NEXT PAGE


