The following is a recap of the May 6 COT Report (Commitment Of Traders) released by the CFTC (Commodity Futures Trading Commission) looking at COT report data and futures positions of non-commercial holdings as of May 3. Note that the change in COT report data is week-over-week. This blog post originally appeared on Hedgopia – Paban’s blog.
Commodities
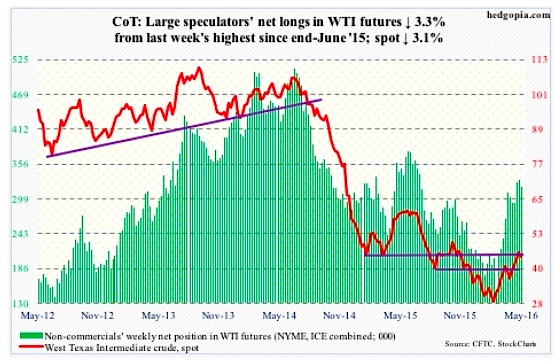
Crude Oil: Wildfire in Canada’s oil-sands district helped crude oil prices. So did tensions between rival factions in Libya. Although not enough to stop spot West Texas Intermediate crude oil from dropping 2.9 percent – its first negative week in five.
The long-legged doji last Friday proved prescient.
That said, bulls should take heart from the fact that broken-resistance-turned support at $43.50 is intact. With weekly conditions as overbought as they are, one wonders how long that support holds.
Fundamentally, for the week ended April 29th, U.S. crude oil inventory continued to rise, up another 2.8 million barrels to 543.4 million barrels. In the past 17 weeks, stocks have gone up by 61.1 million barrels, and are inching ever closer to the all-time high 545.2 million barrels in October 1929.
Gasoline stocks, too, rose – for the second week running – by 536,000 barrels to 241.8 million barrels. And last but not the least, crude oil imports rose 110,000 barrels per day to 7.7 million b/d.
On the positive side, crude oil production continued to slide, this time dropping 113,000 b/d to 8.8 mb/d. This was the fourth consecutive sub-nine mb/d. Production peaked at 9.61 mb/d in the June 5th week last year.
As well, distillate stocks fell by another 1.3 million barrels to 157 million barrels. In the past three weeks, stocks have declined by 6.5 million barrels. And, refinery utilization rose 1.6 percentage points to 89.7.
COT Report Data: Currently net long 318.9k, down 10.9k.
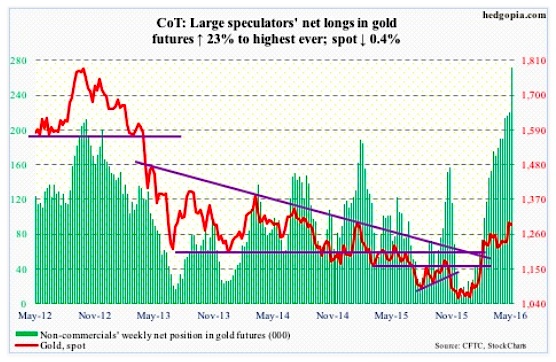
Gold: Last Friday, spot gold prices broke out of the range it had been in since February 11th. That breakout took place at 1,270-ish. The very next session – that is, this Monday – produced a gravestone doji, which, having come after a long uptrend and a couple of long white candles, can signal a potential bearish reversal.
Gold prices lost 0.4 percent for the week, and produced a long-legged doji.
The aforementioned breakout did attract funds into GLD, the SPDR gold ETF, or maybe it was the other way round – meaning the flows helped gold break out. In the week ended Wednesday, $944 million moved into the ETF.
Coming into the week, non-commercials already had heavy net long exposure, and they added more (according to COT report data). Holdings are now at a record high for gold.
Although the aforementioned breakout is intact on spot gold prices, the risk facing these traders, as well as GLD longs, is if the aforementioned gravestone doji is a warning shot across the bow of gold bugs.
COT Report Data: Currently net long 271.6k, up 50.8k.
Equities
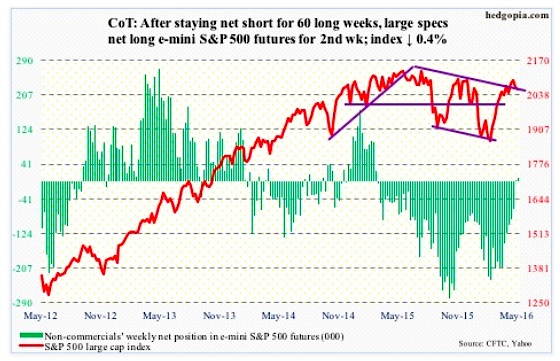
E-mini S&P 500: It took 13 sessions for the S&P 500 index to travel from the upper Bollinger Band to the lower bound, giving back 3.4 percent in the process.
This is also a spot where the stock market bulls needed to put their foot down. The 50-day moving average approximates the lower Bollinger Band. The last time the average was tested from above was right before the collapse in stocks in late December last year. A failure to save it would be a big tell for stocks (and investors) – that selling is accelerating. On Friday, it was breached intra-day, but closed above.
Outflows for stocks accelerated this week. In the week ended Wednesday, a whopping $11.2 billion left U.S.-based equity funds (courtesy of Lipper). This was the largest weekly withdrawal since the week ended January 6th ($12 billion). Since February 10th, nearly $28 billion has now been redeemed. Money is leaving, taking advantage of the rally.
Ditto with SPY, the SPDR S&P 500 ETF. In the week ended Wednesday, all five sessions witnessed outflows, totaling $6.4 billion (courtesy of ETF.com).
This is precisely not what the bulls were hoping to see. Momentum is at risk of slowing down/reversing, and if weekly indicators take over, there is plenty of unwinding left of overbought conditions.
COT Report Data: Currently net long 10.1k, up 8.6k.
continue reading on the next page…


