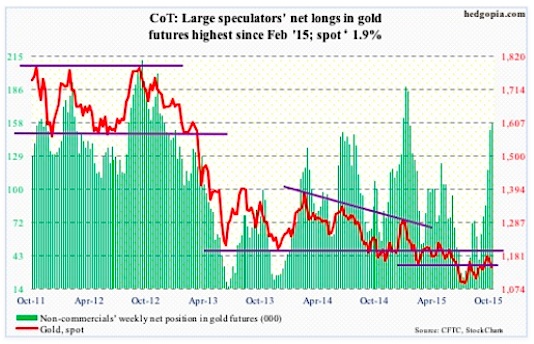
Gold: Immediately after the FOMC statement came out, both gold and equities sold off hard.
Stocks went on to reverse course and close the session up big, while gold stayed down. Apparently, looking at how the short end of the yield curve behaved, how financials and the dollar acted, one would think gold would tag along.
Apparently not… this is not supposed to happen if markets were all girding for a hike come December. Which signal should we trust – the dollar or gold?
Regardless, the metal is sitting at 1,140-ish support, which also approximates three-month rising trend line. The latest selling pressure came after gold was unable to take out two-plus-year resistance at 1,180-ish. Weekly overbought conditions have tons of unwinding left still.
Nonetheless, non-commercials continue to add to net longs per recent COT report data.
COT Report data: Currently net long 157.4k, up 6.1k.
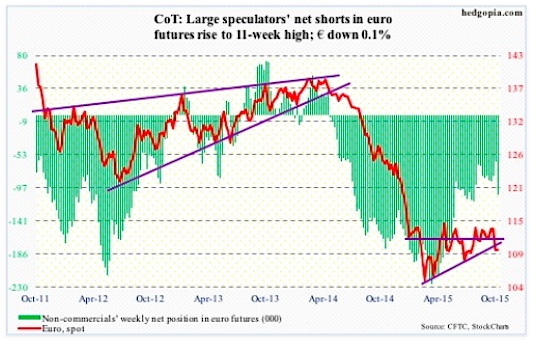
Euro: Last week, thanks to Mario Draghi’s (ECB president) talk of possible announcement of additional stimulus in December, the euro fell three percent, losing both 50- and 200-day moving averages. By Wednesday this week, the Euro was down another 0.9 percent, reacting to the “hawkish” FOMC statement. Buyers showed up near the lower Bollinger band on Thursday.
When it was all said and done, the Euro was essentially flat for the week. Daily conditions are oversold, and there is room to rally. However, last week it sliced through trend line support going back to March this year, the underside of which provided resistance on Friday. Before this, rally attempts throughout this year got repelled at 114.50-ish. Euro bulls have their work cut out for themselves.
COT Report data: Currently net short 105.9k, up 43.4k.
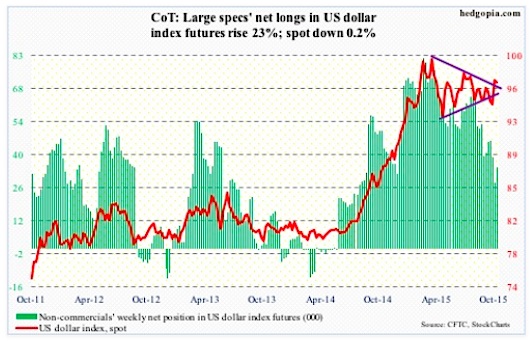
US Dollar Index: Last week, the US Dollar Index poked its head out of a seven-month symmetrical triangle. This week, at one point on Wednesday, aided by the FOMC statement, it was up another 0.7 percent, but was not able to hang on to it, in the end falling 0.2 percent for the week. Either traders’ cooler heads prevailed or it was time for daily overbought conditions to unwind.
The US Dollar Index is less than four percent away from the March high. One common theme in the current earnings season is the lack of revenue growth. Multinationals all blame the strong US dollar. As early as February this year, operating earnings of S&P 500 companies for next year were estimated to be $137.50. This has now been revised downward to $126.96 – still forecast to grow 16.4 percent over this year. Good luck with that – especially if the Federal Reserve does indeed raise and the US Dollar Index follows suit!
COT Report data: Currently net long 34.7k, up 6.5k.
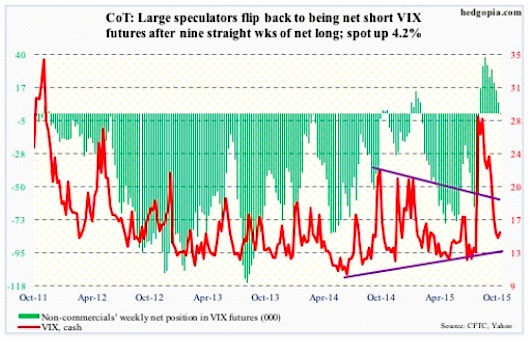
VIX: On Wednesday, spot VIX (Volatility Index) fell under 13 – first sub-13 reading since August 14th – but closed the session north of 14. The daily Bollinger band is tightening. If a sharp move is coming, then odds favor it is to the upside. But a few things need to happen.
The VIX is already at the lower end of its range, and needs to clear the 200-day moving average (16.42; last week was 16.56) for a sustained move higher. The ratio of VIX to VXV has been in the low .80s for three weeks now.
COT Report data: Currently net short 228, up 7.3k.
Thanks for reading!
Twitter: @hedgopia
Read more from Paban on his blog.
No position in any of the mentioned securities at the time of publication. Any opinions expressed herein are solely those of the author, and do not in any way represent the views or opinions of any other person or entity.
: Creating Bullish Divergence?")


 and Semiconductors (SMH): Concerning Price Pattern?")


