The following charts and data highlight non-commercial equity futures trading positions as of January 2, 2017.
This data was released with the January 5 COT Report (Commitment of Traders). Note that these charts also appeared on my blog.
The 2 charts below look at non-commercial futures trading positions for the S&P 500 and VIX Volatility Index. For the week, the S&P 500 ETF (NYSEARCA:SPY) was up +2.6%, while the VIX sunk nearly -20%.
E-MINI S&P 500
January 5 COT Report Spec positioning: Currently net long 172.6k, up 67.9k.
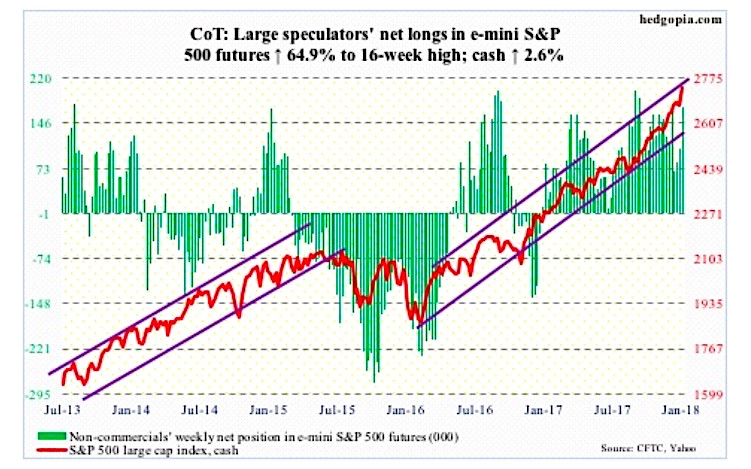
One more mini-breakout on the cash (2743.15) – this time out of a daily flag setup.
Several metrics are beginning to look ridiculous – the monthly RSI, for instance, at north of 86! – but this also points to the bulls’ ability to persistently keep up the pressure. The next time the S&P 500 comes under pressure, they now have 2700 to defend.
This week’s 2.6-percent rally had the full support of non-commercials, but came without much cooperation from flows. At least in the week ended Wednesday, U.S.-based equity funds (including ETFs), lost $8.4 billion (courtesy of Lipper).
In the same week, Vanguard S&P 500 ETF (VOO) and iShares core S&P 500 ETF (IVV) took in $174 million and $677 million, in that order (courtesy of ETF.com). But $2.6 billion came out of SPDR S&P 500 ETF (SPY), following $23.7 billion in inflows in the prior four.
VIX Volatility Index
January 5 COT Report Spec positioning: Currently net short 91.6k, down 5.6k.
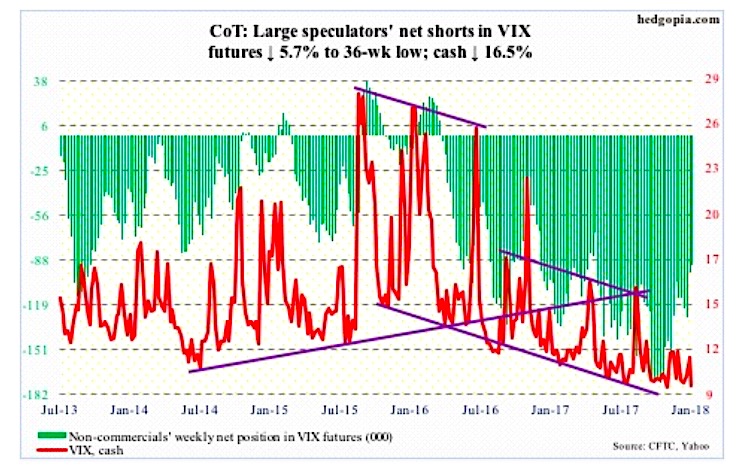
On both Wednesday and Thursday, the daily lower Bollinger band on the cash (9.22) provided support. Several times in the recent past, VIX has shown a tendency to rally off of that band. Should one occur, the question is, will that once again be used as an opportunity to sell volatility, as has persistently been the case?
Things are complacent. Truth be told, though. Complacency thus far has paid off, with strong showing by stocks to start out the new year.
How complacent?
In the options market, the 21-day moving average of the CBOE equity put-to-call ratio was .565 on Thursday. This was the lowest since July 2014. The question is not if this sooner or later gets unwound, rather when – just the nature of things.
Twitter: @hedgopia
Author may hold a position in mentioned securities at the time of publication. Any opinions expressed herein are solely those of the author, and do not in any way represent the views or opinions of any other person or entity.
: Creating Bullish Divergence?")


 and Semiconductors (SMH): Concerning Price Pattern?")


