Soybeans futures have been the darling of the agricultural commodity sector since early August, rallying from a day low of $8.75 per bushel on August 10 up to a 6-year high of $12.80 ½ on December 28.
This represents a 32 percent rally in soybeans futures in only 4 and a half months. Wow.
What’s even more remarkable, though, is this move higher was preceded by a market mired in a 2-year glut of record-to-near record U.S. soybean ending stocks featuring historically weak prices. In fact, spot CME soybeans futures averaged just $8.79 per bushel from July 2018 – July 2020. Comparatively in the 6-months prior to July 2018, spot soybeans futures averaged over $10.00 per bushel.
That said, what caused the abrupt sell-off in soybeans in 2018, what changed this past August, and is this rally sustainable?
What Caused the Sell-Off in Soybeans in 2018?
CHINA – U.S. Trade War: In July 2018 China issued retaliatory tariffs of 25% on U.S. soybeans. Prior to 2018 China had represented more than 50% of all U.S. soybeans exports; while accounting for more than 60% of all world soybean imports. The effect of the levies coupled with a devasting outbreak of African swine fever in China the following year (which decimated its hog herd by more than 50% in 2019) substantially reduced Chinese imports of U.S. soybeans. In 2018 China brought in 16.6 MMT of U.S. soybeans (610 million bushels). In 2019 that figure grew just slightly to 16.94 MMT (622 million bushels). Comparatively pre-tariff, pre-swine flu, 2017 exports of U.S. soybeans to China totaled 32.85 MMT (1,207 million bushels).
Therefore, the combination of the tariffs and swine flu likely cost the U.S. approximately 500 to 600 million bushels in soybeans export business to China in 2018 and 2019. By the numbers, total U.S. soybeans exports averaged 46.65 MMT (1,714 million bushels) in crop years 2018/19 and 2019/20 versus 58.1 MMT in 2017/18 (2,134 million bushels).
So what Changed in August 2020?
CHINA Returns to the U.S. Market: In an attempt to comply and meet at least a percentage of the additional agricultural purchases China agreed to in its Phase 1 Trade Deal signed with the U.S. on January 15, 2020 (equating to +$12.5 billion in China – U.S. agricultural purchases over the 2017 “baseline” total of $24 billion for 2020), China started reemerging as a sizable and more consistent buyer of U.S. soybeans in August 2020. Prior to that China had sourced the majority of its soybean needs from Brazil. However as crush margins continued to improve in China (with hog herds returning to near 90% of normal following ASF) and with Brazil essentially running out of soybeans in advance of its 2020/21 soybean harvest this February, the U.S. once again became a primary origin for Chinese soybean imports. Recent estimates have China already purchasing 31.8 MMT (1,168 million bushels) of U.S. soybeans for shipment during the 2020/21 marketing year.
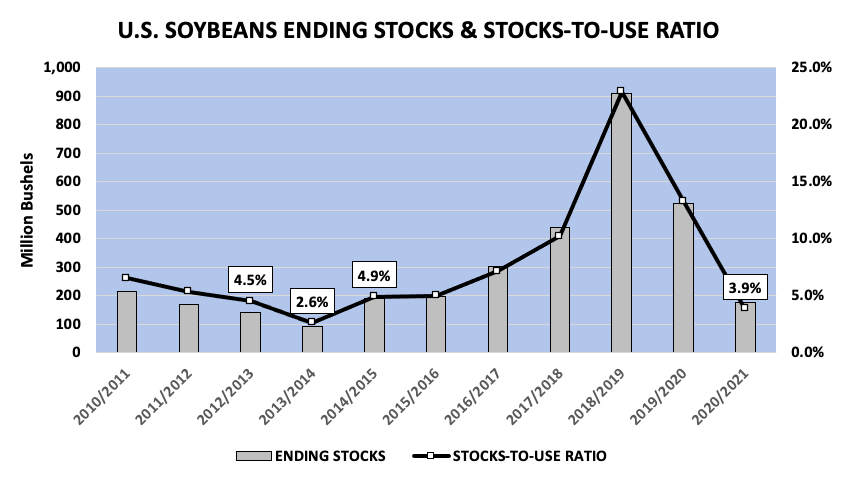
As a result the USDA has now increased total 2020/21 U.S. soybean exports to a record high 2,200 million bushels. Soybeans futures have responded accordingly with 2020/21 U.S. soybeans ending stocks falling to just 175 million bushels, down from 610 million bushels as recently as the August 2020 WASDE report.
Is this Rally Sustainable Above $12.50 per Bushel?
From purely an analog crop year price comparison, it would appear so. The 2020/21 U.S. soybeans stocks-to-use ratio of 3.9% is now the lowest it’s been since 2013/14’s 2.6% (ending stocks of only 92 million bushels).
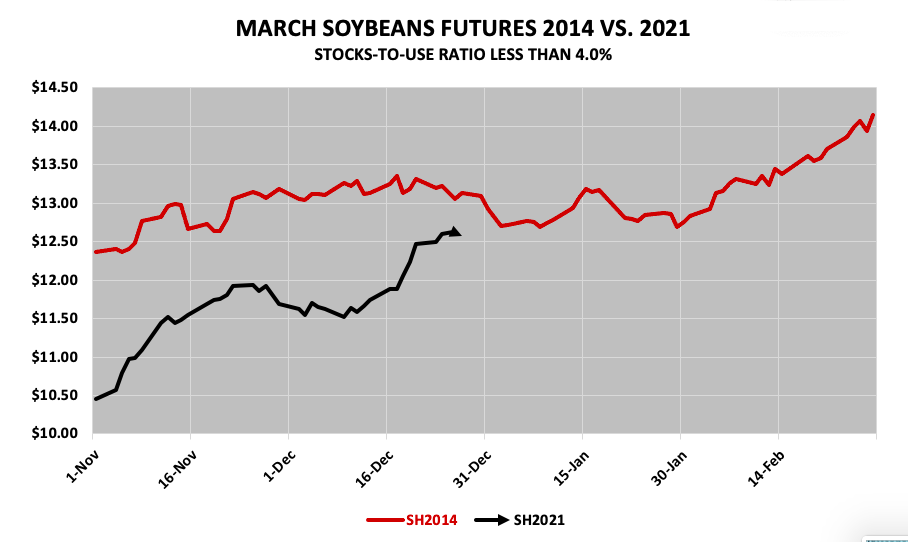
In late February 2014, March 2014 soybeans futures traded up to $14.00 per bushel. If in the USDA’s January 2021 WASDE report (released 1/12/2021) the USDA lowers the U.S. soybean yield -0.5 bpa while increasing soybean exports another 25 million bushels, 2020/21 U.S. soybean ending stocks would fall to approximately 110 million bushels, equating to a stocks-to-use ratio of 2.5%. Will then the USDA lower the U.S. soybean yield in January? I wouldn’t bet against it knowing the USDA has already lowered the U.S. soybean yield -2.6 bpa since August.
Furthermore, considering there are still concerns about the size and timing of Brazil’s 2020/21 soybean harvest, I don’t see China wavering at securing more U.S soybeans even at elevated price levels as long as their domestic crush margins remain profitable. The weakness in the U.S dollar also remains a supportive feature for U.S. soybeans exports, negating a percentage of the “sticker shock” associated with March soybeans futures over $12.50 per bushel for world importers.
And finally, longer-term the U.S. will need to ration U.S. soybean supplies prior to the 2021 U.S. soybean harvest as is (meaning substantially higher price floors into at least early June) with traders already suggesting U.S. soybean acreage will need to expand by 6 to 7 million acres in 2021 simply to make 2021/22 U.S. soybean ending stocks appear more manageable (+200 million bushels) next winter.
Twitter: @MarcusLudtke
Author hedges corn futures and may have a position at the time of publication. Any opinions expressed herein are solely those of the author, and do not in any way represent the views or opinions of any other person or entity.

: Worrisome to Broader Market?")

