The longer the US Dollar Index remains at or near 100, the more difficult it will be for the common grains (Corn, Soybeans, and Wheat) to put in a bottom. As I’ve mentioned before, Corn’s chart looks the best but time and price are beginning to wear on investors.
Wheat and Soybeans continue to trade near their respective lows, but recent rallies have offered a little breathing room. Let’s walk through the current chart setups for the ETFs of each of these Agricultural commodities.
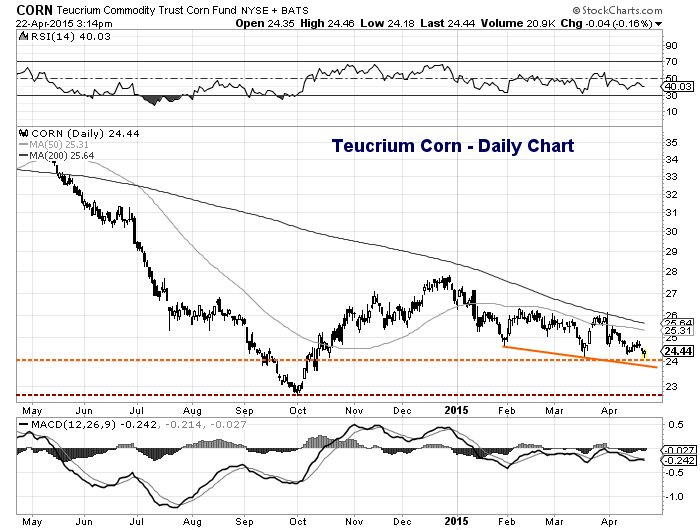
Teucrium Corn (CORN) Daily Chart
One of the more popular ETFs for trading Corn is the Teucrium Corn ETF (CORN). Looking at the chart below, you can see that it’s had trouble finding price support during this latest pullback. In short, it hasn’t been able to make a higher low yet. As well, the ETF has lost its .618 Fibonacci retracement support level at 24.61 and both the 50 day and 200 day moving averages are downsloping.
Very short-term support resides at the 24.20 level, which is a combination of the March lows (24.23) and April lows (24.18). Below that is the lower falling support trend line around 23.75 – this also coincides with the .782 Fibonacci support level (at 23.73). Either way, the Corn chart slipped from slightly bullish to neutral. A loss of 23.75 would imply a full retest of the October lows.
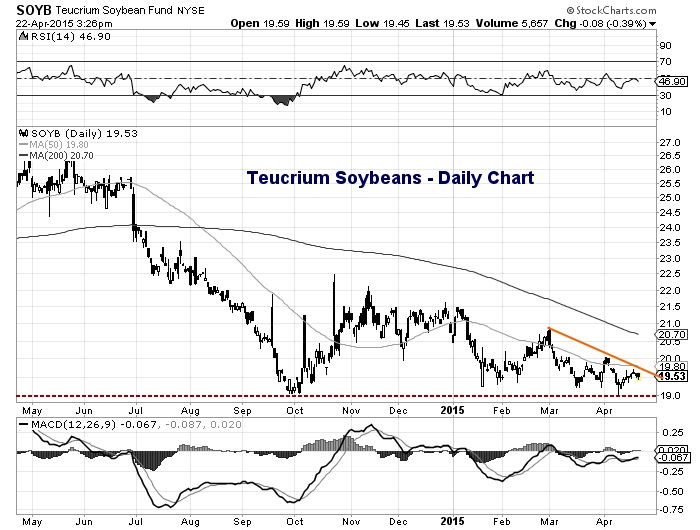
Teucrium Soybeans (SOYB) Daily Chart
Just last week, the Teucrium Soybeans ETF (SOYB) retested its October lows. A rally gave it a little breathing room, but it’s an important technical support level to keep an eye on. SOYB is now testing very short-term resistance (a falling trend line around 19.70). A move above the trend line would be constructive, especially since the 50 day moving average is flattening out. But at the same time, a move back below the October lows would likely signal more pain. Something to watch in the day ahead.
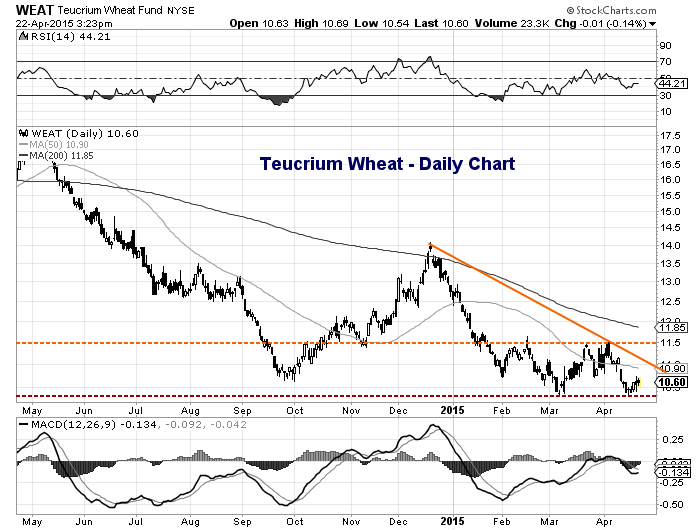
Teucrium Wheat (WEAT) Daily Chart
Several headwinds hit domestic Wheat all at once, including a reduction in overseas demand due to a stronger dollar and oversupply issues. Although the rate of decline has slowed over the past couple months, the Teucrium Wheat ETF (WEAT) remains weak. On a very short term basis, resistance stands at 10.90/11.00. A move above 11.00 would likely trigger a move back up to the February and April highs around 11.50. Support reside at 10.30. Those that are bullish on Wheat will be looking for more broad consolidation over the next 6 to 8 months (in hopes of a base).
Thanks for reading.
Twitter: @andrewnyquist
Author does not have a position in any of the mentioned securities at the time of publication. Any opinions expressed herein are solely those of the author, and do not in any way represent the views or opinions of any other person or entity.

: Worrisome to Broader Market?")
