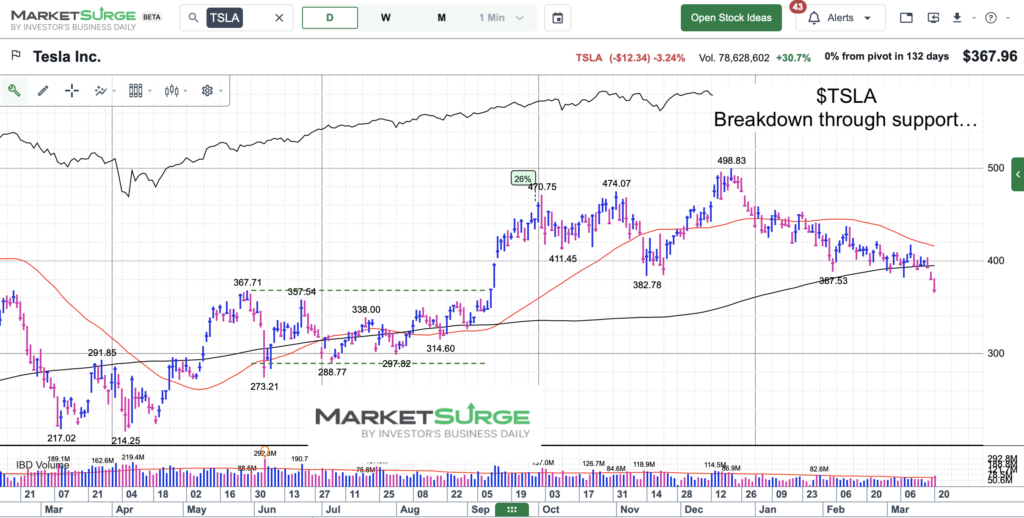
Shares of Tesla (NASDAQ: TSLA) have been testing important price support for weeks now.
Well, that is until a couple days ago when shares of Tesla (TSLA) fell below support and continued lower.
This pattern will likely see a rally to test the breakdown area… failure here will lead to lower prices yet, while a quick recovery will give the stock short-term life. I bet on the former.
Below is a simple chart sharing these findings.
Note that the following MarketSurge charts are built with Investors Business Daily’s product suite.
I am an Investors Business Daily (IBD) partner and promote the use of their products. The entire platform offers a good mix of tools, education, and technical and fundamental data.
$TSLA Tesla Stock Chart
Here we can see the breakdown below the 200-day moving average and horizontal support. This is bearish short-term and will require a bottoming price structure before one can expect a new bull market.
Twitter: @andrewnyquist
The author may have a position in mentioned securities at the time of publication. Any opinions expressed herein are solely those of the author, and do not in any way represent the views or opinions of any other person or entity.


: Important Breakout Retest")


