Tesla Motors stock price is at a critical juncture for trend followers.
Let’s provide some background first, then discuss the chart below.
Tesla Motors stock (NASDAQ:TSLA) began trading on June 29, 2010 at $19, hitting a high the following day at just over $30. It proceeded to move sideways for the next 28 months, making a low on October 26, 2012 at $27.02. That day marked a launch point for TSLA as it increased more than ten-fold over the next 2 years, topping just shy of $300 in September 2014.
The stock has consolidated in the 2 years since, ranging between $180-$280, save for a temporary spike lower to $141 in February of this year. Using a log scale, a trend line drawn from the October 2012 launch point near $27 and connecting the February 2016 low near $141 would place it currently in the $193 range. Yesterday, TSLA made a low of $193.45, testing 6-month lows and trend line support.
Tesla Motors Stock Chart (TSLA)
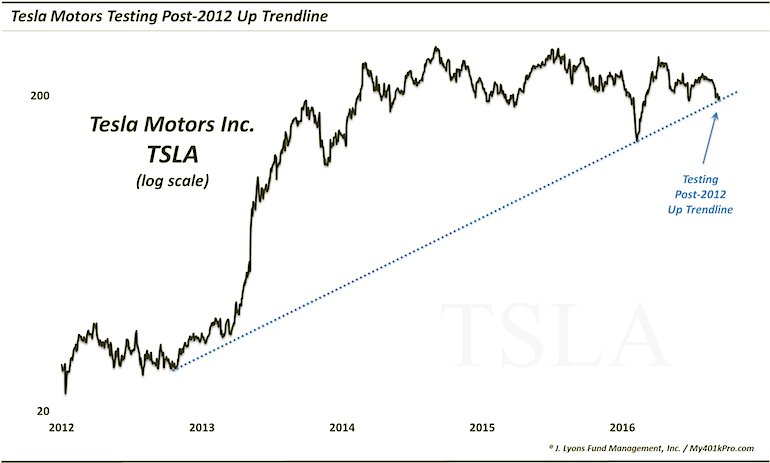
Holding above this trend line may be an important task for TSLA. If valid, the trendline, in concert with the current proximity to the bottom of the 2-year range, may provide a healthy boost in Tesla Motors stock price. On the other hand, a break below the trend line (that is not immediately reversed), could provide the impetus for an acceleration in selling pressure.
Thanks for reading.
More From Dana: Regional Bank Stocks Face Stiff Resistance
Twitter: @JLyonsFundMgmt
The author does not have a position in mentioned securities at the time of publication. Any opinions expressed herein are solely those of the author, and do not in any way represent the views or opinions of any other person or entity.


: Showing Some Signs of Emerging Strength")
