This year got off to a rough start for stock market bulls.
While some may label this as just another correction, it’s been much more than that. Or at least there’s been a lot more going on under the surface.
Tech stocks and small cap stocks have taken the brunt of the selling as value stocks are reasserting themselves. If this shift (value to growth) sticks, it would be a big deal for portfolio managers. But that’s another story.
Today, I simply look at the Nasdaq 100 Index and discuss the current rally attempt. I try to frame the rally using Fibonacci retracement levels and moving averages as guideposts. The index is coming into a critical area this week, so we should know more about this rally soon!
Note that the following MarketSmith charts are built with Investors Business Daily’s product suite.
I am an Investors Business Daily (IBD) partner and promote the use of their products. The entire platform offers a good mix of analysts, education, and technical and fundamental data.
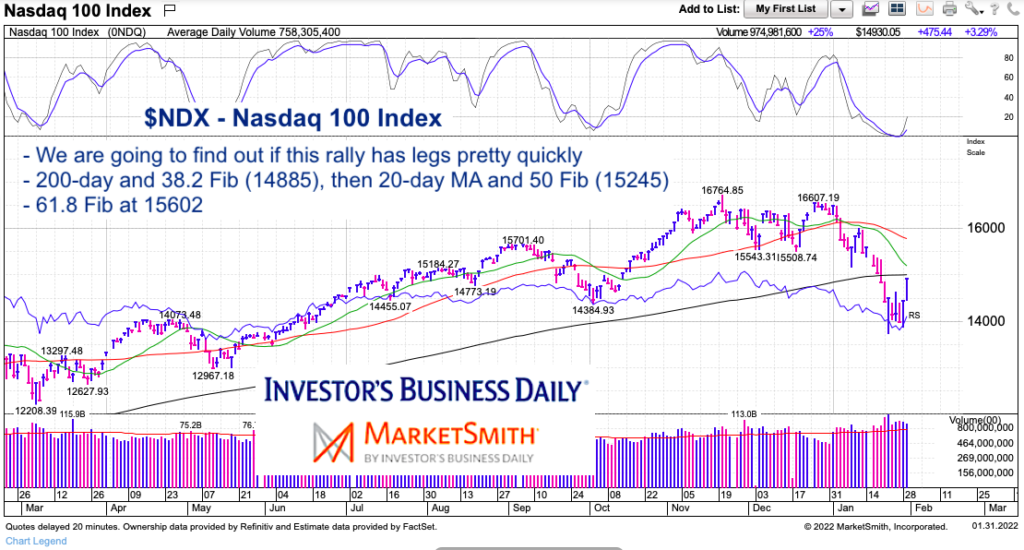
Nasdaq 100 Index “daily Chart
The short-term analysis for the Nasdaq 100 Index is pretty simple. The rally is coming into two critical resistance areas: It is currently testing the 200-day moving average and 38.2 Fibonacci level (14885). If price exceeds this area, then look for a quick test of the 20-day moving average and 50 percent retracement (15245).
The rally would then have room up to the 61.8 Fibonacci (15602) and falling 50-day moving average. Price would need to exceed this area for bulls to regain control of the correction.
Twitter: @andrewnyquist
The author has a trading position in mentioned securities or similar at the time of publication (long QQQ). Any opinions expressed herein are solely those of the author, and do not in any way represent the views or opinions of any other person or entity.


")


