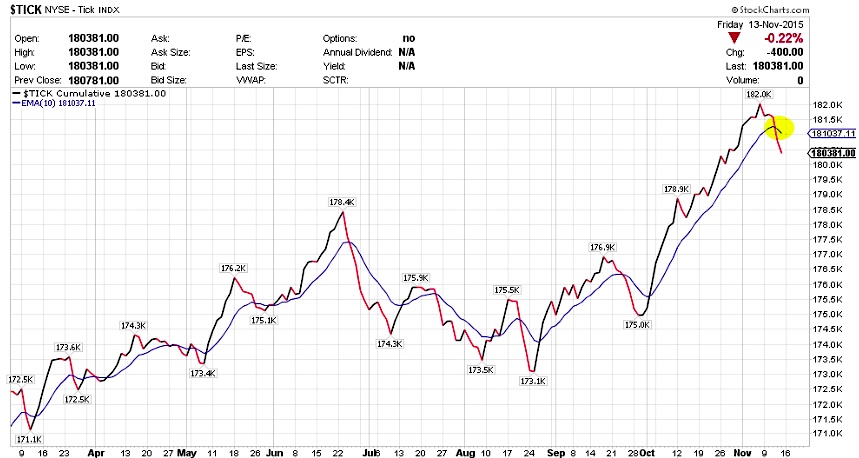
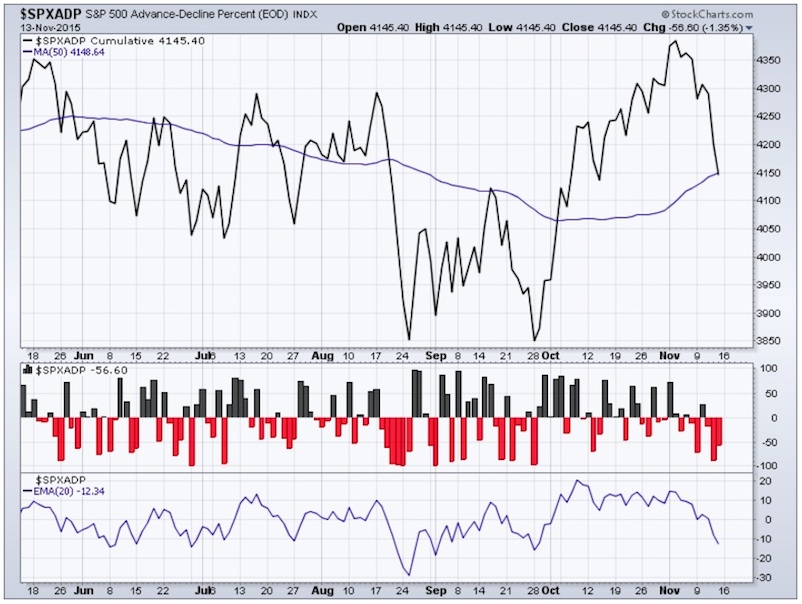
$TRIN & $TICK Stock Market Indicators:
$TRIN spiked higher during the intraday session on Thursday and Friday but ended last week at 1.27.
Keep an eye on $TRIN as any pop in it towards 2.00 or 3.00 can mean a short term low for stocks.
In the mean time, $TICK crossed below the 10 day EMA and is falling. I mentioned in my message stream last to week to take notice of this as it was starting to curl lower last Tuesday. I wouldn’t be surprised to see more negative ticks driving this lower before a cross above 10 EMA like August or September.
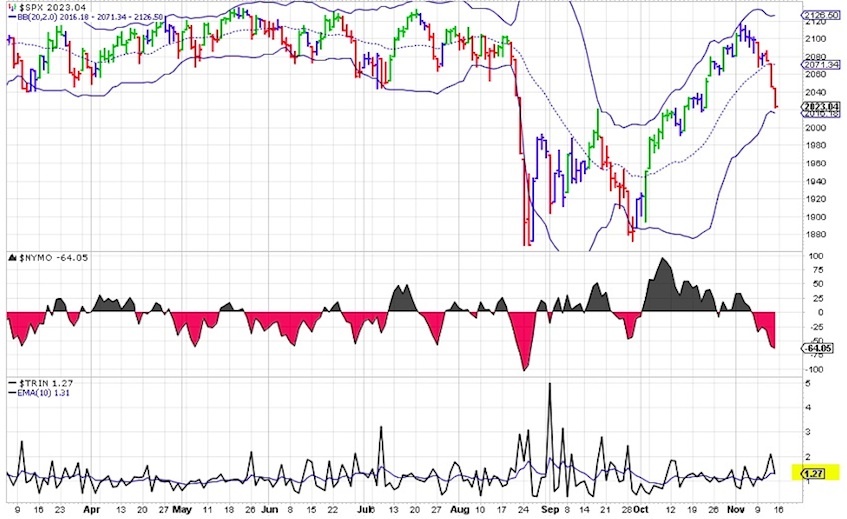
$SPXADX – Advance-Decline Percent Data:
The Triple view of the Advance Decline data for $SPX. As mentioned last week, the S&P 500 Advance-Decline Percent is now right at the 50 day moving average. Need to see how far it pulls back if it goes lower than 50 day moving average. Note though that the 50 MA here is rising which is still bullish in the bigger picture.
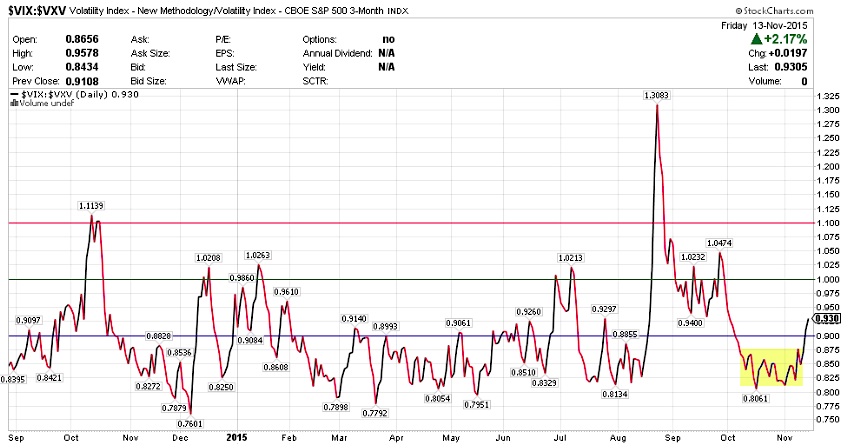
$VIX:$VXV – Volatility Term Structure:
$VXV is the 3 month volatility index. The relationship between $VXV and $VIX (30 day volatility) or the ratio between them if > 1.00 often spells trouble for stocks. This ratio has turned back higher and finished the week at 0.930. As long as it stays below 1.00, consider this pop in Volatility Index (VIX) as a short term move higher and nothing more.
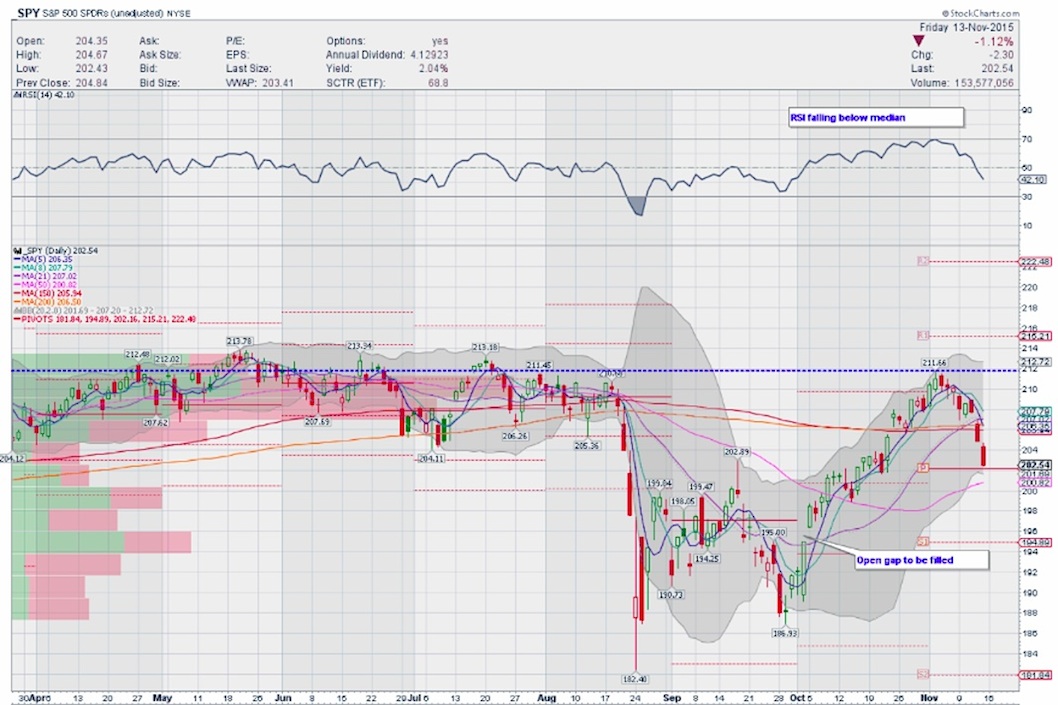
$SPY Daily Time Frame:
On a Daily timeframe, the S&P 500 ETF (SPY) started lower towards 206.95 but some bounce on Tuesday gave some hopes for the bulls. However, from then on $SPY started moving lower on Wednesday through Friday with that last Friday’s price action resembling the August move lower prior to the big fall lower. I’m not saying we go that route but something to take notice of and with Paris news, definitely something to watch out for, just in case. During this down lower, $SPY closed one unfilled gap around 205 zone.
With $SPY near the 50 day SMA on Friday after hours, a move lower towards 200 or even lower towards 198 is possible. However, that can signal a short term oversold bounce. Again, let price confirm where a bounce will occur and its sustainability. Keep in mind that there is an unfilled gap lower near 195 if the S&P 500 slips toward a stock market correction.
With respect to momentum indicators, the Relative Strength Index (RSI) on the S&P 500 is now firmly below median and falling and suggests more room for lower prices. MACD that made a bearish crossover earlier during the week started falling and continues to fall. Slow STO was overbought at the start of the week and getting embedded. Now it is at oversold levels. It need not turn right away as it can get embedded before turning up. Overall, I’m looking for lower prices on this timeframe.
Thanks for reading and have a great week.
Twitter: @sssvenky
The author has a position in S&P 500 related securities. Any opinions expressed herein are solely those of the author, and do not in any way represent the views or opinions of any other person or entity.

: Showing Some Signs of Emerging Strength")
