Let’s get right into the stock market review. I’ve been repeatedly mentioning for the past few weeks that investors should be cautious with this market after the huge run up in October.
How this stock market pullback shakes out will determine if the highs are in for the year or if we find support and rally higher in earnest. There are good arguments on both sides and I intend to explore them here.
There were quite a few hints in last week’s stock market review. For now, the path of least resistance for stocks is lower (until price proves otherwise).
Market breadth has been weak overall despite the recovery. The break of 2070-2080 zone in the S&P 500 (SPX) definitely should have raised some caution amongst traders. Immediate support resides around 2020, followed by the next viable support zone around 1984-85.
Again, caution is warranted as volatility seems to be perking up. Probably best not to over trade on either side. This is a note to self as well.
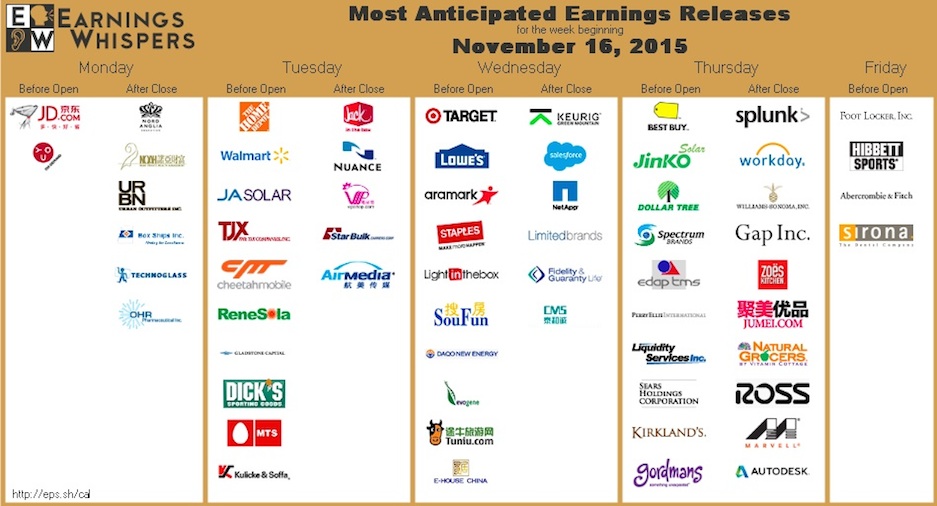
Earnings season is almost coming to a close. However, we still have some big retailers reporting this upcoming week like Walmart (WMT), Target (TGT) etc. Walmart in particular has been hammered of late (looks like the market liked their earnings). Here’s the entire list provided here below via Earnings Whispers (@eWhispers).
As far as the Economic Calendar goes, it is certainly heavier than last week. We have CPI and Industrial production on Tuesday, Housing Starts on Wednesday but the most important one is the FOMC minutes release and that again is on Wednesday afternoon. Watch for potential fireworks on either side of the tape. James Bullard and a few Federal Reserve representatives talk this week.
BREADTH INDICATORS:
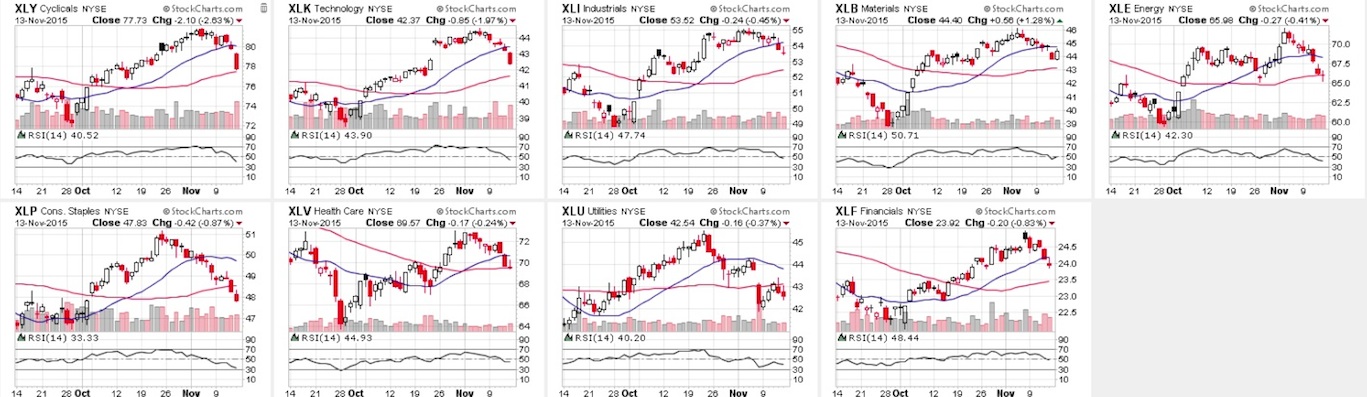
Sector performance Candlesticks glance:
Here’s how the S&P 500 sectors performed with respect to the Relative Strength Index (RSI). None of the sectors were oversold coming into the week and likely have more room lower. But after a big move lower last week, a bounce may be in order. The charts below are heading into this week.
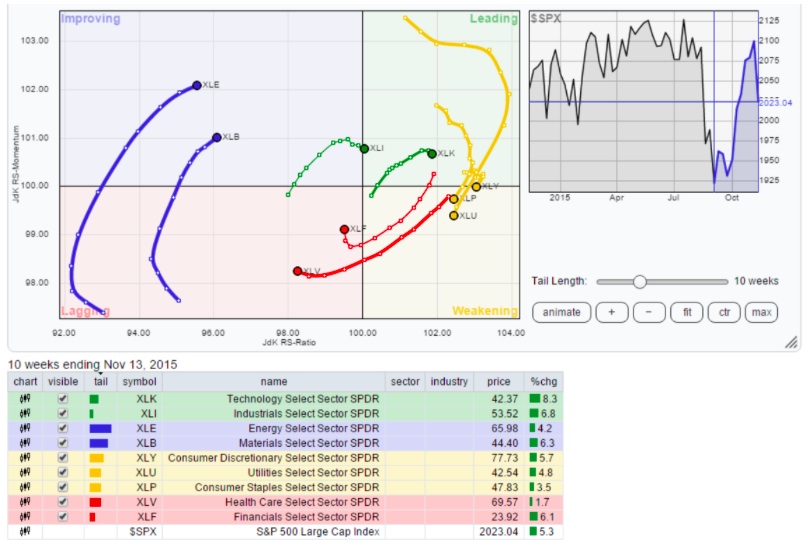
Here’s the Relative Rotation Graph (RRG) chart showing the leaders and the laggards among the 9 sectors heading into the week.
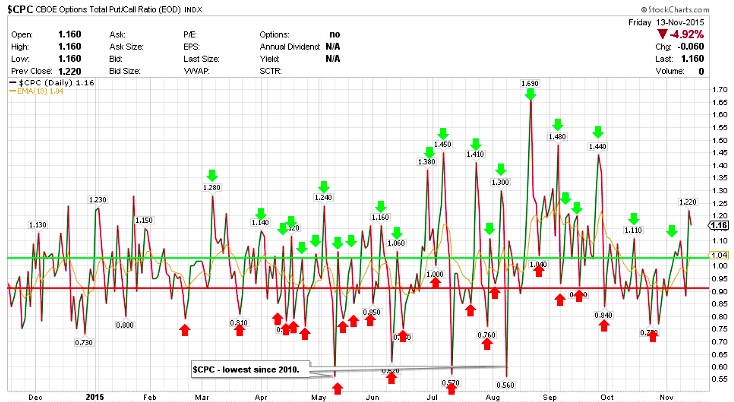
$CPC – Put/Call Ratio:
The Put-Call ration popped higher towards 1.220 but now seen it turn a tad. However this is only the daily view of the CBOE Options Total Put-Call Ratio. One reason I was alluding to earlier that this may be a minor stock market correction was because the Equity only put-call ratios have remained on buy signals even during this decline. Also, the 21 day moving average for Equity Put-Call Ratio is still pointing lower after rolling over from the highs in October. This bodes well for stocks as long as it remains lower. If it does move higher, that will surely mean more weakness and will change the scenario to more than just a minor stock market correction. Keep an eye on what this does.
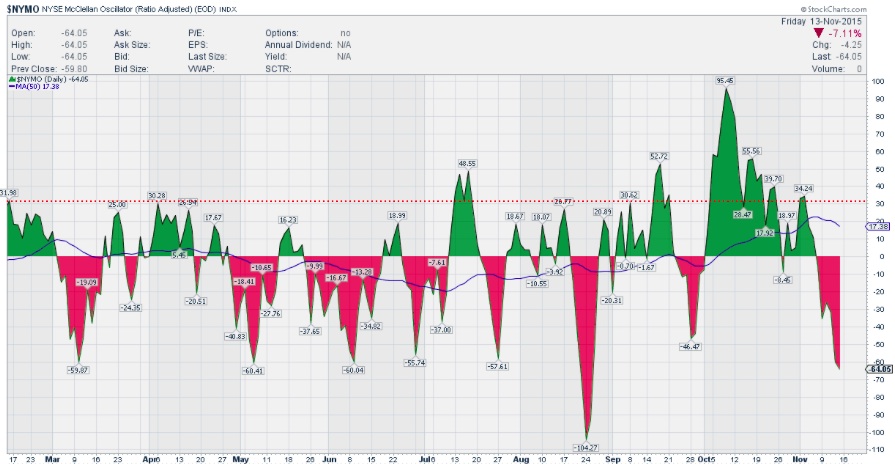
$NYMO (McClellan Oscillator):
The McClellan Oscillator is oversold and finished the week at -64.05. Anything below -60 is oversold and $NYMO was -80 during the intraday session on Friday. A short term bounce is possible. Remember not to overstay your welcome unless this goes back above the zero line.
continue reading on the next page…


