As of last Thursday, with 53.1 percent of S&P 500 companies having reported, blended 1Q19 operating earnings estimates were $37.23, up from $36.69 two weeks ago but down from $41.12 last August.
Estimates for the remaining three quarters this year are $40.65, $43.02 and $44.46. For the year, the consensus expects $165.35, which, if realized, would have grown 9.1 percent over 2018.
Last year, earnings jumped 21.8 percent and 17.2 percent before that. Next year, growth is expected to reaccelerate to 12.6 percent!
Leaving next year’s pie-in-the-sky estimates aside, as things stand, nearly 53 percent of this year’s earnings is expected to be generated in the second half. Hence the importance of how ‘macro’ behaves as the year progresses, and of inventory burn – not to mention a scenario in which end-demand weakens.
This is also not a scenario currently anticipated by non-commercials who are neck-deep in net shorts in VIX futures. Mid-December last year, they were net long 44,245 contracts – just before stocks bottomed. The cash VIX went on to rally to 36.20 intraday, before reversing.
Seven sessions ago, the VIX made an intraday low of 11.03, which was the lowest since last August.
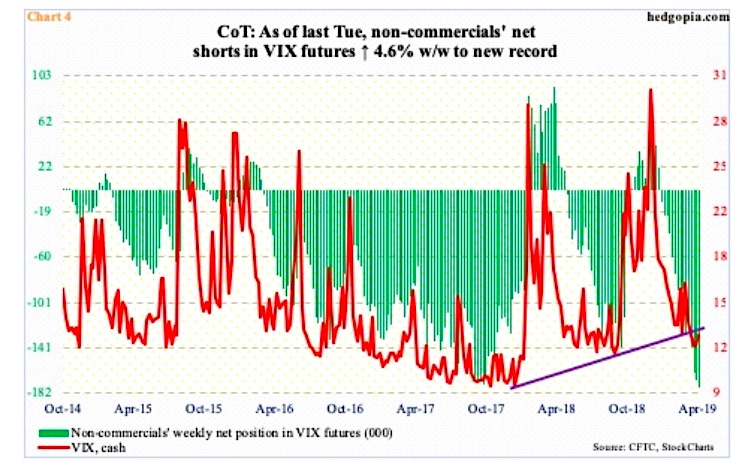
Non-commercials, who are now at the other extreme, continue to bet that volatility remains suppressed. Last week, they added 7.8k week-over-week to take their net shorts to 177,754 contracts – a new record (Chart 4). The prior high was recorded in October 2017. When stocks began to sharply correct in January-February and October-December last year, these traders’ net shorts were much lower. This is a dynamic equity bulls should not take their eyes off of.
Just because VIX net shorts are at a new record, stocks do not have to begin to correct right here and now. But with each tick higher, risks of unwinding rise. This suggests a surge in the cash is a matter of when, not if.
There is another dynamic that is increasingly gaining in importance.
Mid-April, short interest on SPY (SPDR S&P 500 ETF) dropped 9.1 percent period-over-period to 134.2 million shares (chart here). This was the lowest since end-December 2017. Back then, late January 2018, stocks began a quick, sharp correction.
One of the hallmarks of this bull market has been the typical ‘climbing the wall of worry’. There is no dearth of issues for bears to latch on to. They express their pessimism by shorting, which in due course comes back to bite them in the rear. Year-to-date, the S&P 500 large cap index is up 17.3 percent; SPY short interest is down 35.8 percent. From bulls’ perspective, low short interest also means lesser fuel for short squeeze.
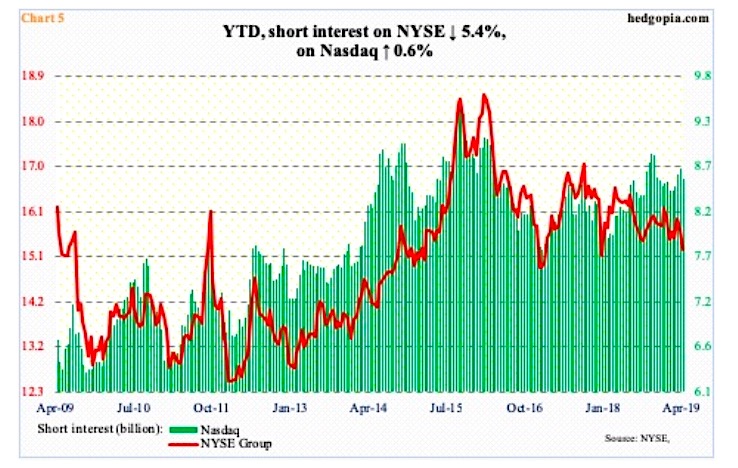
Using index-level short interest, the picture is slightly hazy at best. Year-to-date, NYSE short interest is down 5.4 percent, while on the Nasdaq it is up 0.6 percent (Chart 5). On the latter, shorts have stayed put despite the nearly 23 percent rally this year. Time will tell if these shorts get rewarded for their doggedness or they end up getting squeezed. Small-caps may play a role in this.
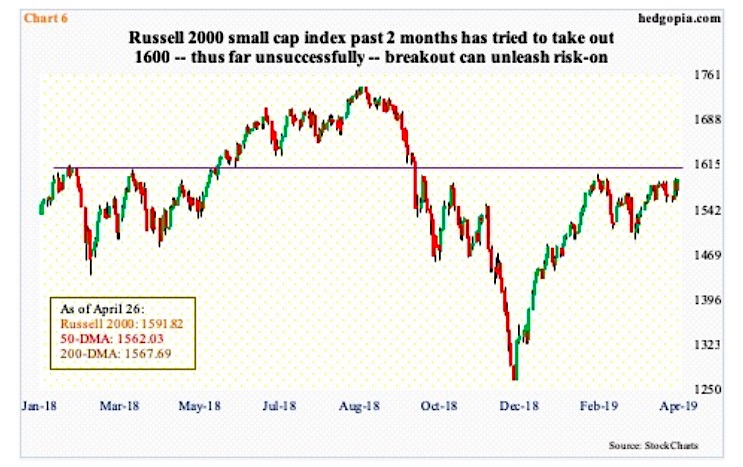
Rightly or wrongly, small-caps are perceived to be risky. Traders demand them when they are in risk-on mode. The Russell 2000 small cap index so far this year is up 18 percent, versus, as mentioned before, 17.3 percent for the S&P 500 and 23.6 percent for the Nasdaq 100. The latter, too, is used to measure investor penchant for risk-on.
The otherwise-lagging Russell 2000 is at a crucial juncture. What happens here can dictate how stocks perform in the near term. A breakout just north of 1600 can act as a self-fulfilling prophecy for the entire market.
In January last year, the Russell 2000 retreated after hitting 1615.52. Subsequently, this level would act as both resistance and support. Last October, selling accelerated once bulls lost that support. Then, after the index bottomed last December, the rally stopped at 1602.10 two months ago.
Since then, 1590s has been hit several times, including twice last week, closing at 1591.82. A breakout here could unleash some risk-taking, pulling tech-heavy indices along. Once again, Nasdaq short interest is relatively high. This is also a scenario in which non-commercials can continue adding to net shorts in VIX futures. This is short term.
Medium- to long-term, odds are rising equity bears will have the last laugh. Those VIX net shorts will get unwound sooner or later.
Twitter: @hedgopia
Author may hold a position in mentioned securities at the time of publication. Any opinions expressed herein are solely those of the author, and do not in any way represent the views or opinions of any other person or entity.

 Testing Important Price Support")
: Cup (and Maybe Handle) Watch")

