I’ve seen the phrase group think a couple of times lately as an apt description of today’s stock market. Group think, herd mentality, it’s all the same. Did you ever watch sheep or cows in a pen? They tend to move around together.
Remember, if we all sit on the same side of the fence, well you know.
Don’t get me wrong, I’m still bullish for as far out as the eye can see in this New Year, but still concerned about the weeks ahead. I have been talking about some mean reversion of late and something that would knock the group thinkers on their backside. We have seen a turn in Treasuries, precious metals, the dollar, emerging markets that I was looking for. However, the stock market, specifically the small caps, the financials, and the industrials have yet to crack. Stay tuned, it’s coming.
So what do I mean by group think? It can be referred to in many ways, but I was using it following the herd mentality after the election. One of the places to be in 2017 is financials. Yes, they look good on the charts from a longer-term perspective, but are in dire need of a break. Checking in on Wall Street’s Strategists’ favorite sector for this year and it’s no surprise that financials are on almost everyone’s list. Recent outperformance = got to own.
Predictions for 2017 are universally bullish as well as tightly packed. That is, year-end (YE) targets are very close together = group think. A survey of 19 strategists’ came up with an average year-end target of 2,368 for the S&P 500 with almost all the estimates within 3% of the average. Before I go any further, I am not taking a shot at strategists. I had to do this for years, and it was very difficult. Where I will take a shot at strategists is that year after year, they generally are lumped together and unwilling to stick their necks out either on the upside or the downside.
So, with many strategists’ YE targets bundled together, what may happen? If the S&P 500 hits or exceeds many of these targets by mid-year, many strategists raise their targets not wanting to be left behind, and the market peaks in the 2nd half, making their original forecasts closer to the YE finish for the “500.” So the danger here with so many forecasts tightly bound is that one way or the other, they get whipsawed together, getting too bullish after the fact or too bearish early this year if we get a jolt to the downside.
Of the major indices, I think the Dow Jones Industrials (INDU) is the most vulnerable to an outsized pullback vs. the S&P 500 and the NASDAQ Composite. Why? Same reason as the small caps, financials, and industrials and that is the recent advance. A healthy advance generally can be described as a stair/step affair. In other words, a couple of steps higher, a step lower, and so on. The only time we tend to see steep runs without pauses and it being healthy is after a major correction or bear market. But for the most part, advances are followed by sideways or counter trend moves and then another advance.
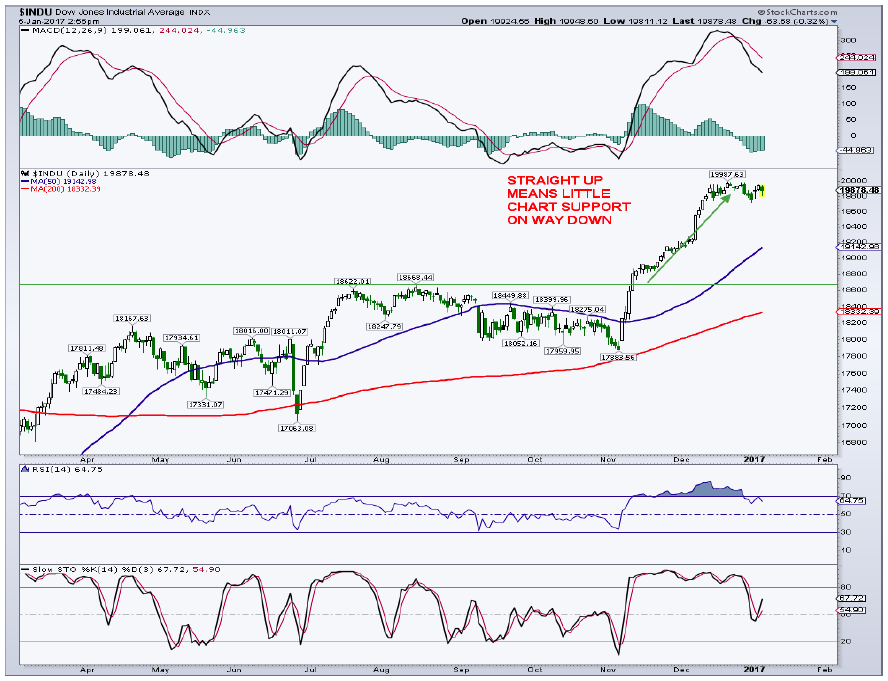
What we have seen on the INDU is basically a missile shot higher without any pauses in between. Why is this not healthy? Because a market that pauses during an uptrend sets up areas of chart support that can act as a floor on the way down.
Taking a look at the chart, the Dow Industrials have run from just below 18,000 straight up to near 20,000. In the process, the index broke out of a sideways consolidation when it closed at a new high above the 18,668. Chart-wise, there is very little if any support all the way back to this breakout level. While I’m not looking for a full-blown retest of the 18,668 level, the index appears very susceptible to decent sized losses here. I will note that the rising 50-day average sits at 19,142 and is really the only piece of support on the right side of the small and potential Christmas tree.
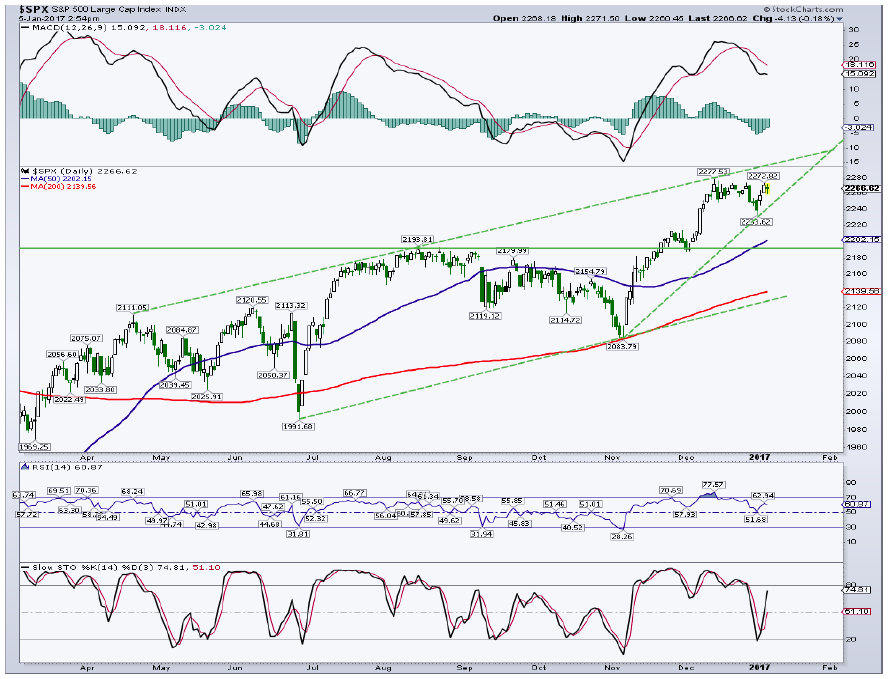
For the S&P 500, there is minor chart support at the recent low of 2,234. Like the INDU, the recent rally was fairly sharp with little in the way of price structure on the way up. The majority of decent support lies down at/near the breakout area of 2,200. The rising 50-day sits at 2,203 and represents support many times during an uptrend. For now, I’m still looking for a test of the 2,200 to 2,220 region before the next leg higher resumes.
Conclusion: Seasonals are no longer a tailwind for stocks and with bullish sentiment roaring, I suspect a decent shakeout (3% to 5%) is coming. Looking out, I see the S&P 500 reaching 2,500+ region sometime in 2017.
Thanks for reading. Reach out to me at arbetermark@gmail.com for inquiries about my newsletter “On The Mark”, if interested.
Twitter: @MarkArbeter
Any opinions expressed herein are solely those of the author, and do not in any way represent the views or opinions of any other person or entity.


: Showing Some Signs of Emerging Strength")
