The second straight quarter of double-digit profit growth has supported the Dow Industrial Average (INDEXDJX:.DJI) move to new highs.
Broader-based indices including the S&P 500 (INDEXSP:.INX) and Russell 2000 (INDEXRUSSELL:RUT) haven’t been able to keep pace but are holding up.
The jobs report on Friday easily beat expectations. The unemployment rate fell to 4.3% from 4.4% as hourly earnings climbed the most in nine months. The employment numbers bode well for the economy in the second half of the year and suggest inflation pressures will remain low. Additionally, the persistent decline in the U.S. dollar in 2017 cannot be understated. Dollar weakness helped stimulate export growth, which reached more than a two-year high in June. The falling dollar also assisted multinationals improve their bottom line, far outpacing what was reported by domestic corporations. From here many of the elements that supported the equity markets remain in place but the near-term risks have increased as we enter the two weakest months for stocks historically.
Given the ongoing strength in the economy, any weakness that does develop is expected to be limited to 2375 on the S&P 500 where there is strong support.
Technically, the longer-term bullish trend that developed following the February 2016 bottom remains in force.
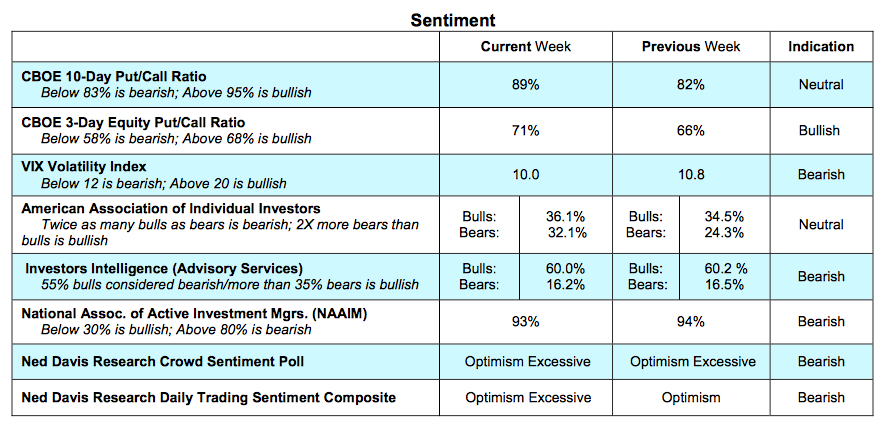
Near term, however, the technical picture is less encouraging. There has been a noticeable loss of momentum in the market at a time when investors’ enthusiasm for stocks is spiking. The latest report from Investors Intelligence, which tracks the mood of Wall Street letter writers, shows nearly four times as many bulls than bears. The most recent survey from the American Association of Individual Investors (AAII) shows the lowest cash levels since January 2000, while Charles Schwab reports the largest number of new accounts in 17 years.
Market breadth indicators have deteriorated with fewer issues hitting new 52-week highs. The percentage of stocks trading above their 200-day and 50-day moving averages has been unable to break a pattern of lower highs, another indication of weakening breadth. The level and trend in margin debt also suggests short-term caution. Margin debt is nearly double what was seen at the 2000 peak and has declined for two consecutive months. Rising margin debt is considered bullish as it represents growing demand. Declining margin debt argues that demand is waning.
Thanks for reading.
Twitter: @WillieDelwiche
Any opinions expressed herein are solely those of the author, and do not in any way represent the views or opinions of any other person or entity.


")


 Rolling Over At Key Fibonacci Level?")