What a month for investors!
November 2016 was a month that most of us will not forget. And I’m not talking about politics, but returns in many different asset classes. I generally do not recite returns or other general information that is already thrown around by plenty other analysts and the media, but here goes.
The Russell 2000 Index (INDEXRUSSELL:RUT) rallied 11% last month. Believe it or not, this performance has been equaled or exceeded a number of times over the past 20 years, mostly coming out of bear market or major corrections. Ominously, it did occur in February 2000, but I’m not going in that direction just yet. The Financial Sector ETF (NYSEARCA:XLF) soared 14%, a return equaled and exceeded in 2009 and late 2011. It also occurred in 1999 and March 2000. The Industrials Sector ETF (NYSEARCA:XLI) rocketed 9.1%, also equaled and exceeded coming out of major bear markets and corrections, but also during 1999 and March 2000.
Besides equities, there was quite a bit of movement in the U.S. Dollar Index (CURRENCY:USD) as well as the Treasury market. Note that the 10-Year Treasury Note Yield (INDEXCBOE:TNX) is currently 33% above its 200-day average.
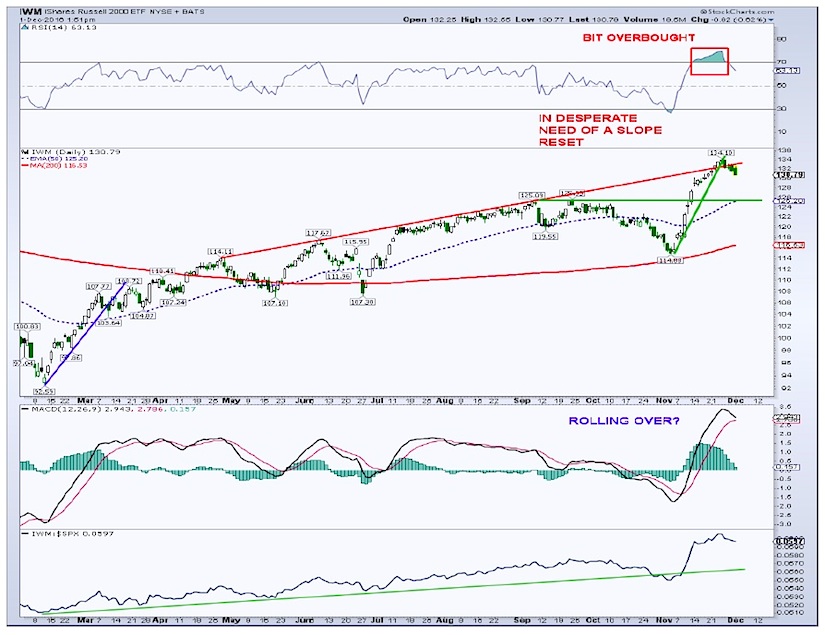
So where might some of these indices and markets reverse to? Starting with the Russell 2000 ETF (NYSEARCA:IWM), the 14-day RSI recently hit 80, which is about as overbought on a daily basis as the small cap index gets historically. The steep trend line has been busted and a slope reset looks to be taking place. With the IWM near 131.50, the first potential support is a gap in the 128 zone. Because the index rose so fast, there is little chart support until the breakout area of 125. Coincidently, this is also the location of the 50-day exponential average, which many times acts as support during pullbacks. Also of note, the daily MACD is rolling over from a very high level, so some near term caution is warranted for the small stocks.
As soon as treasury yields broke out, the financials (XLF) got a huge lift. The 14-day RSI on XLF recently hit 86, the most overbought on a daily basis in the past 20 years. The ETF is making another new high today and is not really showing any topping activity like the Russell 2000 yet. Despite the momentum, I would expect to see some pullback here soon as the selling in treasuries exhausts itself.
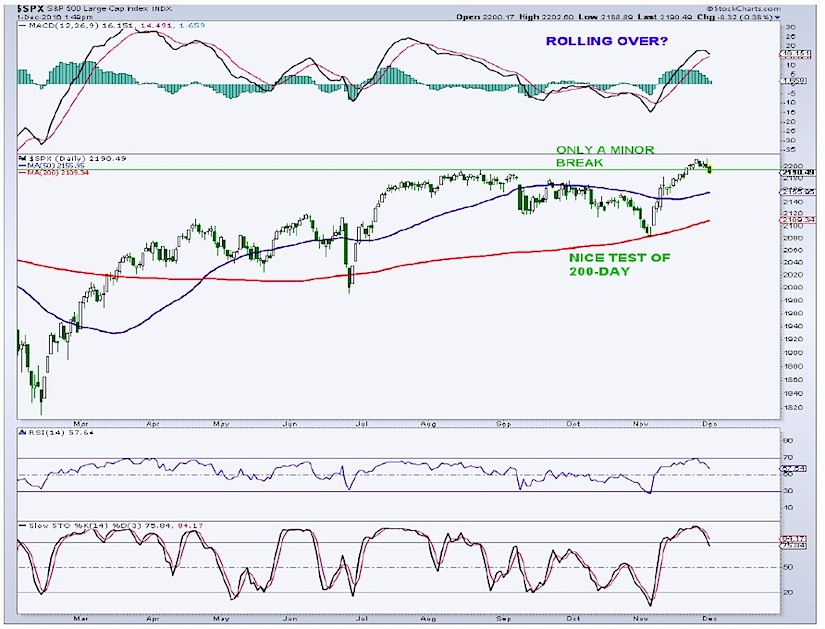
The S&P 500 Index (INDEXSP:.INX) hasn’t done a whole lot over the past 7 days and is currently testing the highs from this summer in the 2,195 area. As I mentioned here last week, I do not consider the move by the “500” to a new high to be a breakout of significance as it was only 1% on a price basis, and so far, there has been no follow through. In addition, it occurred after a fairly quick move and pushed daily momentum readings into overbought territory. As I mentioned before, trying to get too cute calling for minor pullbacks is a fools game, but I’ll be looking for a decline back to the 2,150 to 2,170 area of chart support before the next leg higher begins. The rising 50-day average comes in at 2,156 and represents support during uptrends.
Overall market sentiment is unfortunately stretched to the bullish side once again, and is in need of at least a little reset. Using sentiment at this stage of the bull market, especially when each pullback is bought aggressively, is difficult. One sentiment indicator showing a high degree of optimism is the National Association of Active Investment Managers survey or the NAAIM Exposure Index. This weeks’ reading was 98%, showing very high exposure to equities. This index generally oscillates between 0% and 100%. When exposure to the market gets this high, equities either have a tough time making any upward progress or they eventually pullback.
Conclusion: There is an old adage: The only free lunch on Wall Street is the mid-December low. Maybe this works again and provides another opportunity to reload. Also, look for some of these markets to mean revert. Looking out, I see the S&P 500 reaching the 2,300 to 2,500 region later this year or in the first half of 2017.
S&P 500 Index Chart
Russell 2000 ETF (IWM) Chart
Thanks for reading. Reach out to me at arbetermark@gmail.com for premium newsletter inquiries, if interested.
Twitter: @MarkArbeter
Any opinions expressed herein are solely those of the author, and do not in any way represent the views or opinions of any other person or entity.


")

")

