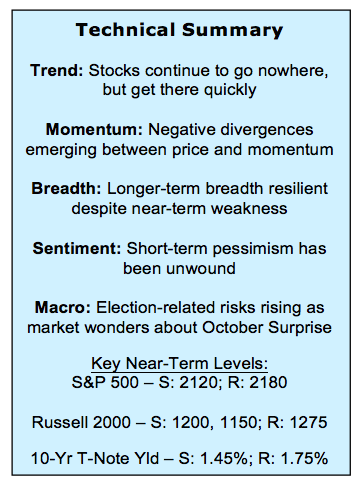
Stock Market Weekly Outlook & Technical Review – October 7
Here’s a look at some key stock market indicators and emerging themes that we are watching in our latest “Stock Market Outlook”:
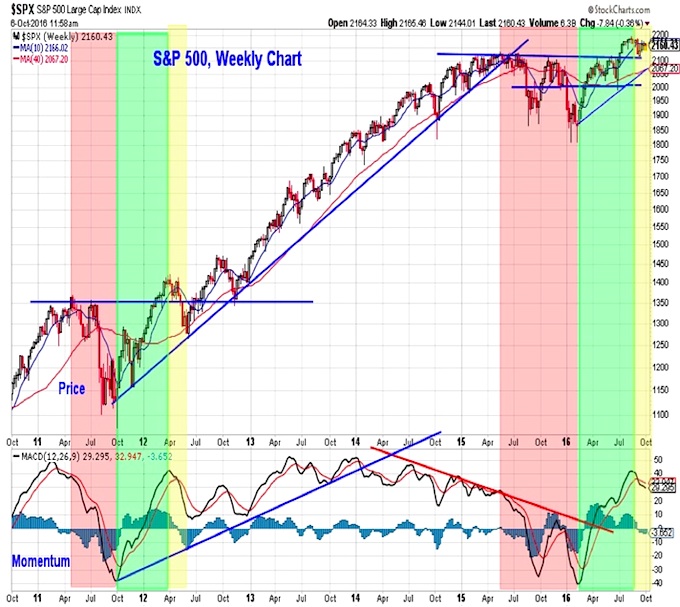
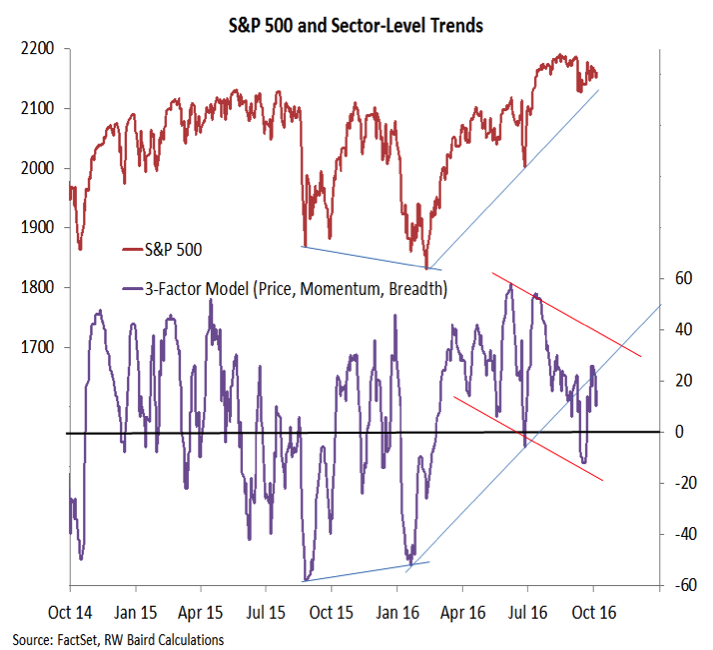
Breadth Not Giving the “All Clear” to Bulls – While longer-term breadth trends remain robust, near-term trends do not yet suggest stocks are poised to get back in gear to the upside. This is consistent with the pattern that is emerging on the weekly S&P 500 chart, which suggests we could see more volatility prior to an expected post-election rally for stocks.
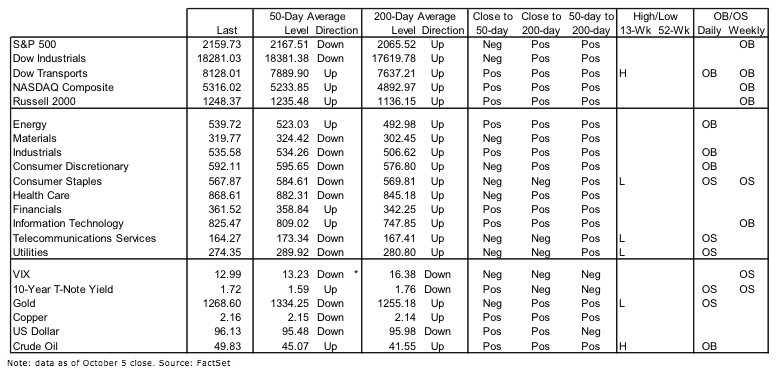
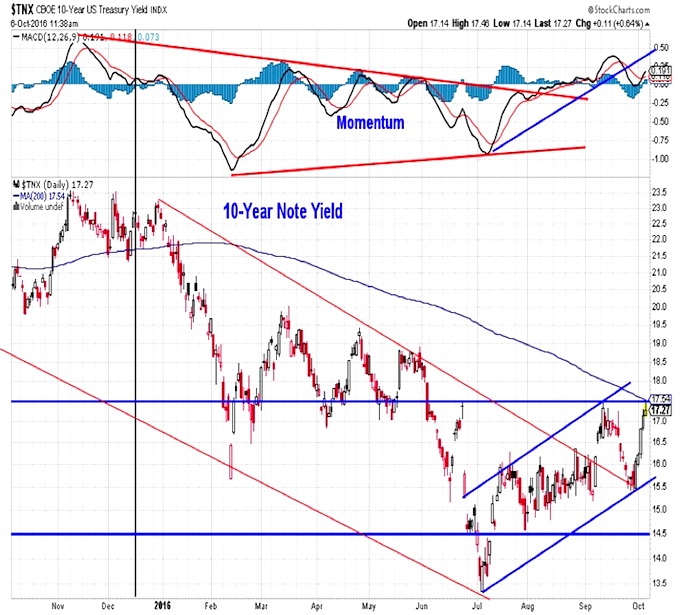
Rise in Bond Yields Impacting Stocks – Bond yields have started to move higher across the yield curve. While still near historically low levels, a pattern of higher highs and higher lows for yield has emerged. This is negatively impacting the Utilities sector at a time when cyclical strength had already started to re-emerge. Attempts to add low volatility stock market exposure has left some investors experiencing increased volatility.
Gold Breaks Down – After failing at resistance (near $1380/oz) in August, gold made a pattern of lower high. That was followed this week with a big break below support near $1300/oz. Some support could come at the 200-day average near $1250/oz, but with momentum falling and bond yields rising, a test of early-year support near $1200/oz looks likely.
Stock Market Indicators
S&P 500
The weekly chart on the S&P 500 suggests that the initial move off of the February lows has been completed. Using the 2011-2012 pattern as an example suggests that if support near 2120 does not hold we could see the index move quickly beneath 2100, with the 40-week average (currently near 2067) coming in as a potential support level. A turn higher in the weekly momentum indicator would help support the view that this corrective phase has run its course and the longer-term up-trend is poised to re-assert itself.
Our shorter-term breadth indicators also suggest that stocks are not yet ready to break out to the upside. Our look at sector level trends shows that the divergence pattern remains intact. After providing a positive divergence early this year, the sector-level trend indicator did not confirm the post-Brexit highs and has been trending lower while the S&P 500 has moved sideways for the better part of three months. Other short-term breadth indicators confirm this. The number of stocks making new highs has remained lackluster, and the percentage of stocks trading above their 50-day averages is below 60% on the NASDAQ and below 50% for the S&P 500.
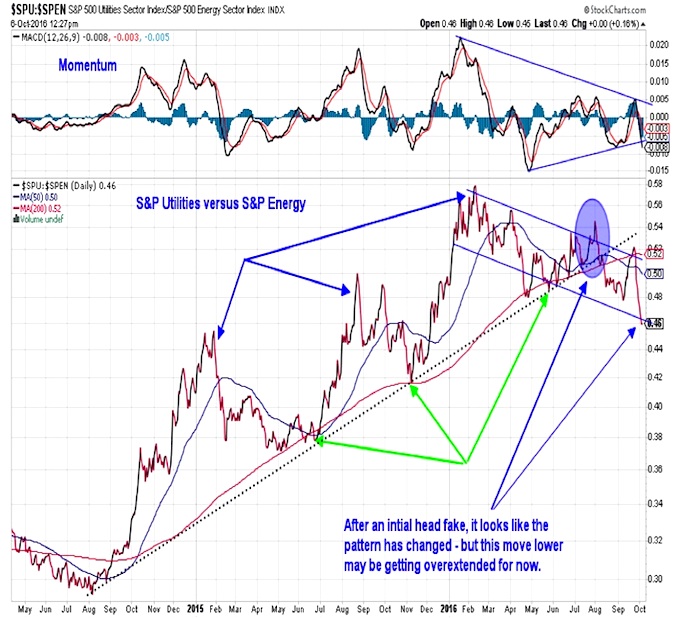
S&P Utilities and Energy
While the indexes are going nowhere, we are seeing a distinct rotation to more cyclical leadership. Our sector relative strength work shows leadership from Information Technology and Industrials. We have featured the chart to the right in the past and think it does a good job of capturing this rotation. After a head fake in the third quarter suggesting leadership from Utilities was still intact, we have seen a significant move away from Utilities and toward Energy. While this move may be overdone on a short-term basis, we could be in the early stages of this new trend.
10-Year Treasury Note – Bond Yields Rise
The low-volatility/high-dividend investing theme that pushed Utilities to better than 20% YTD returns by mid-year got very crowded (and expensive), leaving it vulnerable to even the smallest hiccup. The appears to have emerged in the form of a still modest rise in bond yields (the 10-year 10-Note yield is 40 bps off its lows, but is still 50 bps below where it began the year and is only now approaching its 200-day average.
continue reading about Gold, the Dollar & more on the next page…


