Frankly, the answer to the title is “I don’t know”. In fact, I don’t think any one knows that just yet.
There are times when you have trust in seasonality and stock market correlations, whether or not they work 100%. Such was this past week. As I mentioned in last week’s market outlook, the week did have a strong ending similar to the 2011 analog. And if correlations play out again, this upcoming week should start strongly but sellers may sell strength towards the middle to end of the week.
As expected, the month of September was soft and here we’re off to the races in October but not without some surprises. A lot of constructive action to end last week with the MACD crossing up on many stock market indices (on shorter timeframes). With corporate earnings starting next week, the question is: will 3rd Quarter earnings derail the rally that we are seeing? Very possible as 3rd Quarter earnings are typically weak.
According to Ryan Detrick (@RyanDetrick), historically speaking, the best you can hope for after a negative YTD on the S&P 500 through Q3 is 0%. 2011 was -0.0025%. Correlation? Probably yes but only time will tell how we finish 2015.
The NFP numbers on Friday were bad but it’s worth noting that this is a survey and the economy did add jobs. One important factor though is that the rate hike which the Fed has been talking about will likely be put off for quite some time.
Enough said, the Economic Calendar is not as heavy as last week but there are a few releases that could get the markets on edge again. The FOMC is the item and that is out Thursday 2:00 PM EDT. Remember that this is the same day that the official earnings season starts. So I expect volatility to return. There are others releases as well, such as PMI Services Index, ISM Non-Mfg Index, MBA Mortgage application etc. but not as big as FOMC as everyone will be looking for clues about the economy and rates.
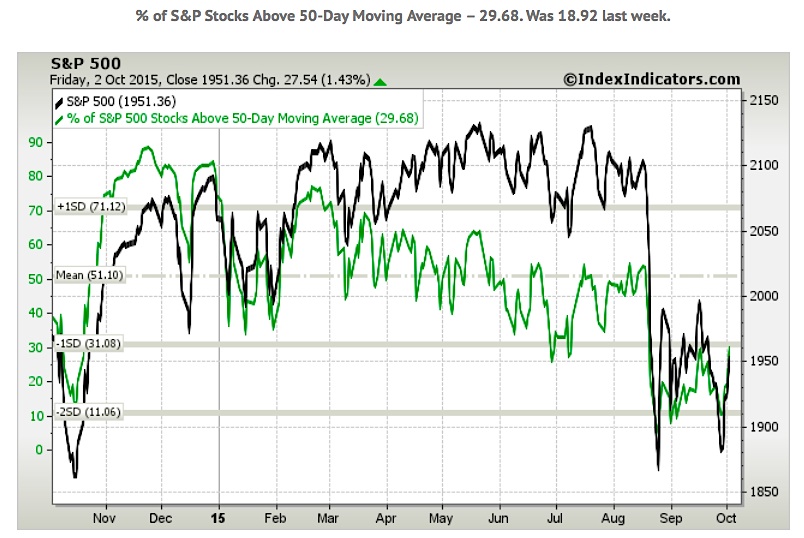
Alright, let’s see what the charts are saying. First we’ll look at some stock market breadth indicators, then some S&P 500 ETF (SPY) charts.
Sector Performance And Market Breadth Indicators:
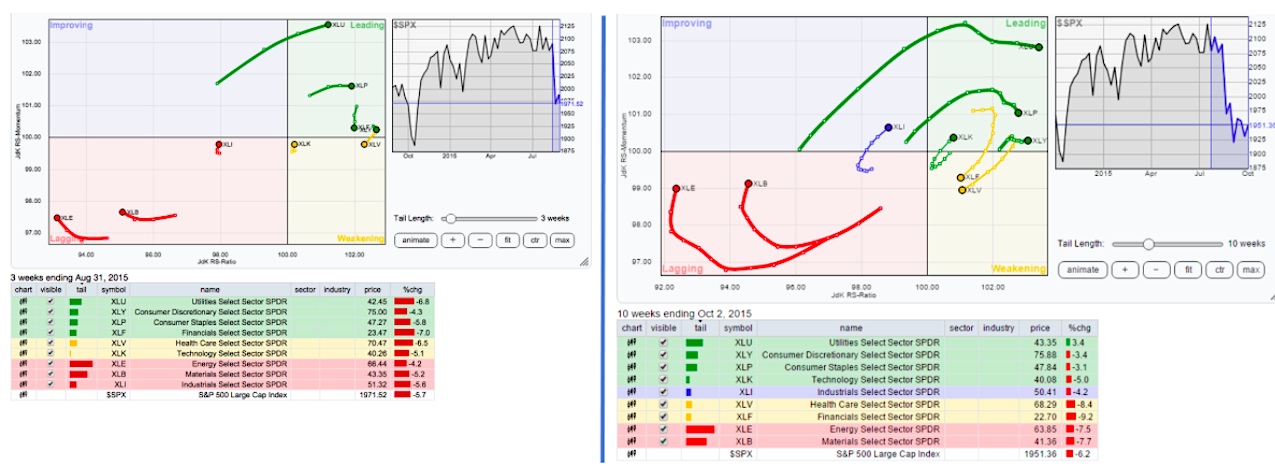
Here’s a look at the Relative Rotation Graph (RRG) chart for the S&P Sectors showing the leaders and the laggards. The one on the left is the one posted by Vinny Gambini aka TL LeBlanc (@Cousin_Vinny) on August 31st and the one on the right is the current one that I exported on October 3rd. See how $XLE $XLB and $XLI were turning then and where they are now. RRG charts show you the relative strength and momentum for a group of stocks or a sector as a whole. click to enlarge
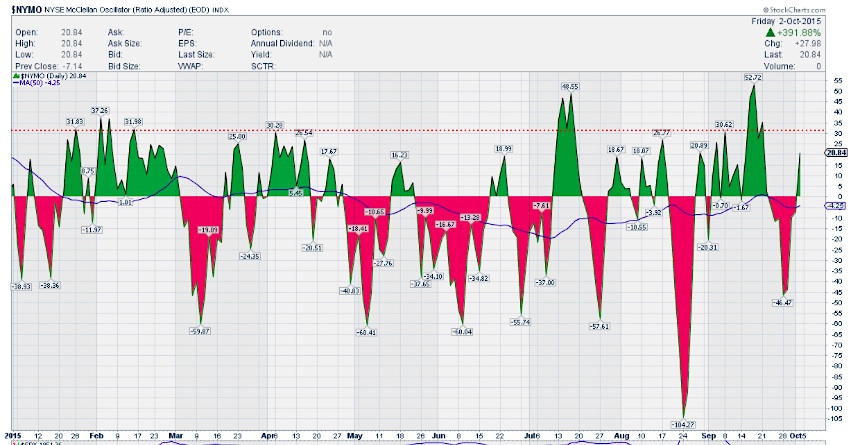
$NYMO (McClellan Oscillator):
$NYMO started the week lower, continued lower with mini intraday bounces. It was not totally oversold but was at a place where it has retraced higher and it did move higher. Friday dropped lower again but mid-day move above 0 line and stayed positive to end at 20.84. If stocks follow through Monday into a few days next week, then this will be much higher, probably gets overbought for another leg lower.
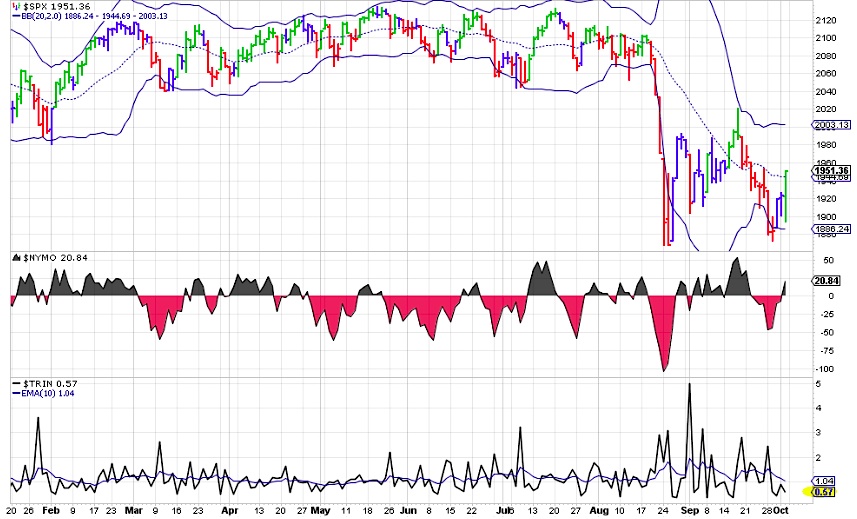
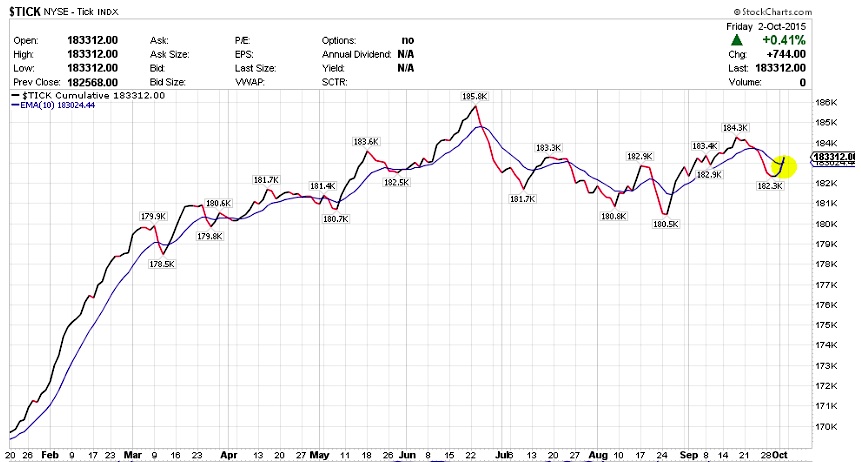
TRIN & TICK Market Indicators:
The TICK indicator continued lower but crossed above the 10 EMA on Friday. A very bullish sign even if it is just short-term. If I am not wrong the highest TICK was 1441 and there were quite a few +1000s in the afternoon. The TRIN indicator, which was elevated pretty much during first half of the week, trended lower on Thursday and Friday. Especially Friday, this was a great gauge when it was trending < 0.80 when stocks were tanking. This is exactly what I posted when I saw TRIN that it was not confirming the move lower. Additionally, the Volatility Index (VIX) also was stalling after the initial spike.
continue reading on the next page…

 Flirting With Critical Support… Again")


