S&P 500 Index (SPX) – Advance-Decline Data:
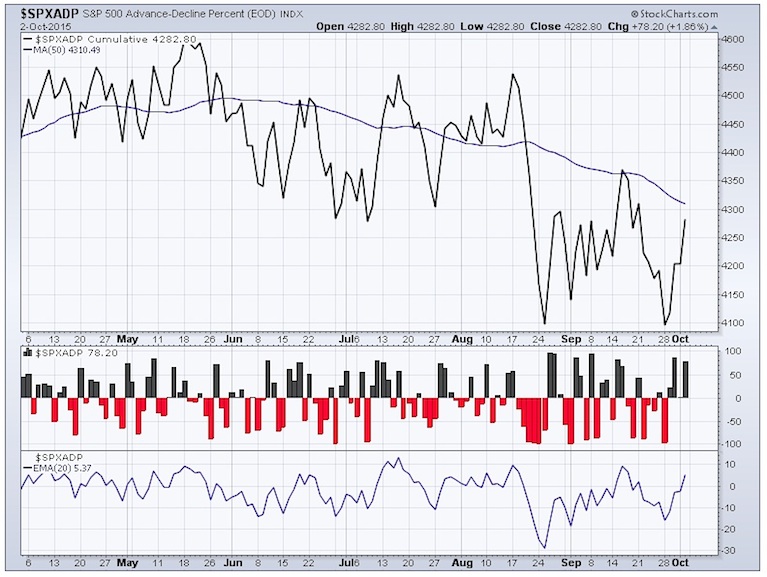
The next chart depicts a few different ways to review Advance-Decline data.
The A-D Line was declining into early last week when it turned Thursday and began to rise Friday. Rising above the 50 day moving average would be ideal but it’s worth noting that the 50 day MA is still declining.
VIX – CBOE Volatility Index:
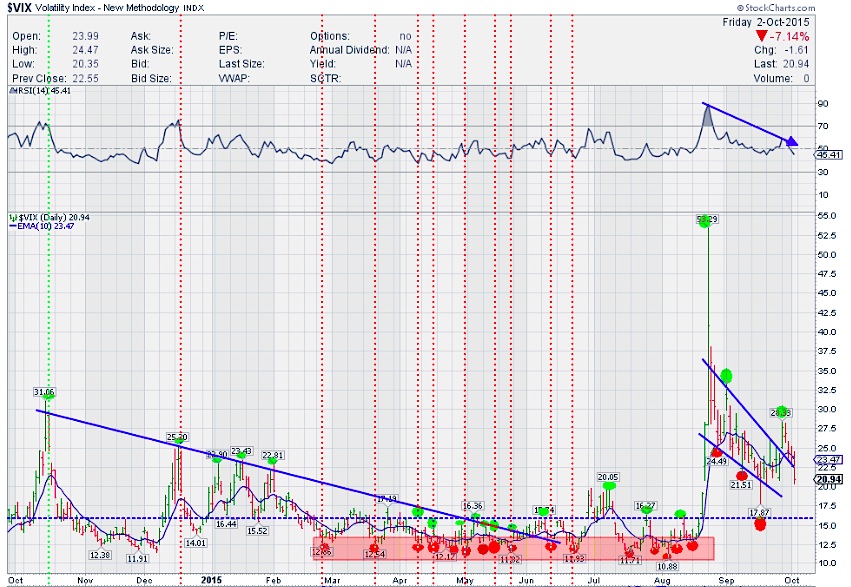
The VIX finished the week weaker than before but still above 20. It started the week with the bang higher but eventually plummeted on Friday. RSI is moving lower below the median. The MACD crossed lower and fell on this timeframe. Stoch RSI is in the oversold area but has room to stay there for sometime before moving higher. As long as volatility stays > 20, it may remain elevated.
S&P 500 ETF (SPY) Daily Timeframe:
On a daily timeframe, the S&P 500 ETF (SPY) started last week with a big move lower. Price broke the big support of 190 and moved lower towards 187. SPY continued lower on Tuesday but stalled at 186.93. Price was well shy of the August 24th lows. It printed a DOJI candlestick, which means indecision. Price was confirmed higher on Wednesday, back above the important 190 level. However, to add to a confusing week, on Thursday it printed a HangingMan candle, often meaning a reversal lower. On Friday, with the NFP numbers coming in below estimates, price had a steep move lower from the pre-market readings all the way below 190 levels towards 188-189. However, a strong reversal on heavy volume ensued (possibly due to extreme oversold conditions #exhaustion) and SPY reversed course and headed higher, finishing very strongly above the 21 SMA, with a Marubozu candlestick.
Price is still below the declining 50 SMA but 21 SMA is leveling though and trying to turn. This is a very good sign. Ideally the 21 SMA should be above 50 SMA and 5 above 8 SM. These may take some time but eventually this will be very bullish overall.
A $7 move from the lows on Friday is huge and small pause some time soon will be more meaningful than continuing higher. Ideally a couple of inside days will certainly help the cause of any overbought conditions on the shorter timeframe charts.
As far as momentum indicators go, RSI has turned up and is moving towards the median. MACD has crossed up and this should give some fuel to the upside. However, it is below the median. Slow STO also is rising from oversold levels but below median. Some work is needed but still very constructive. Some confirmation certainly is needed next week, if price ought to move higher on this timeframe.
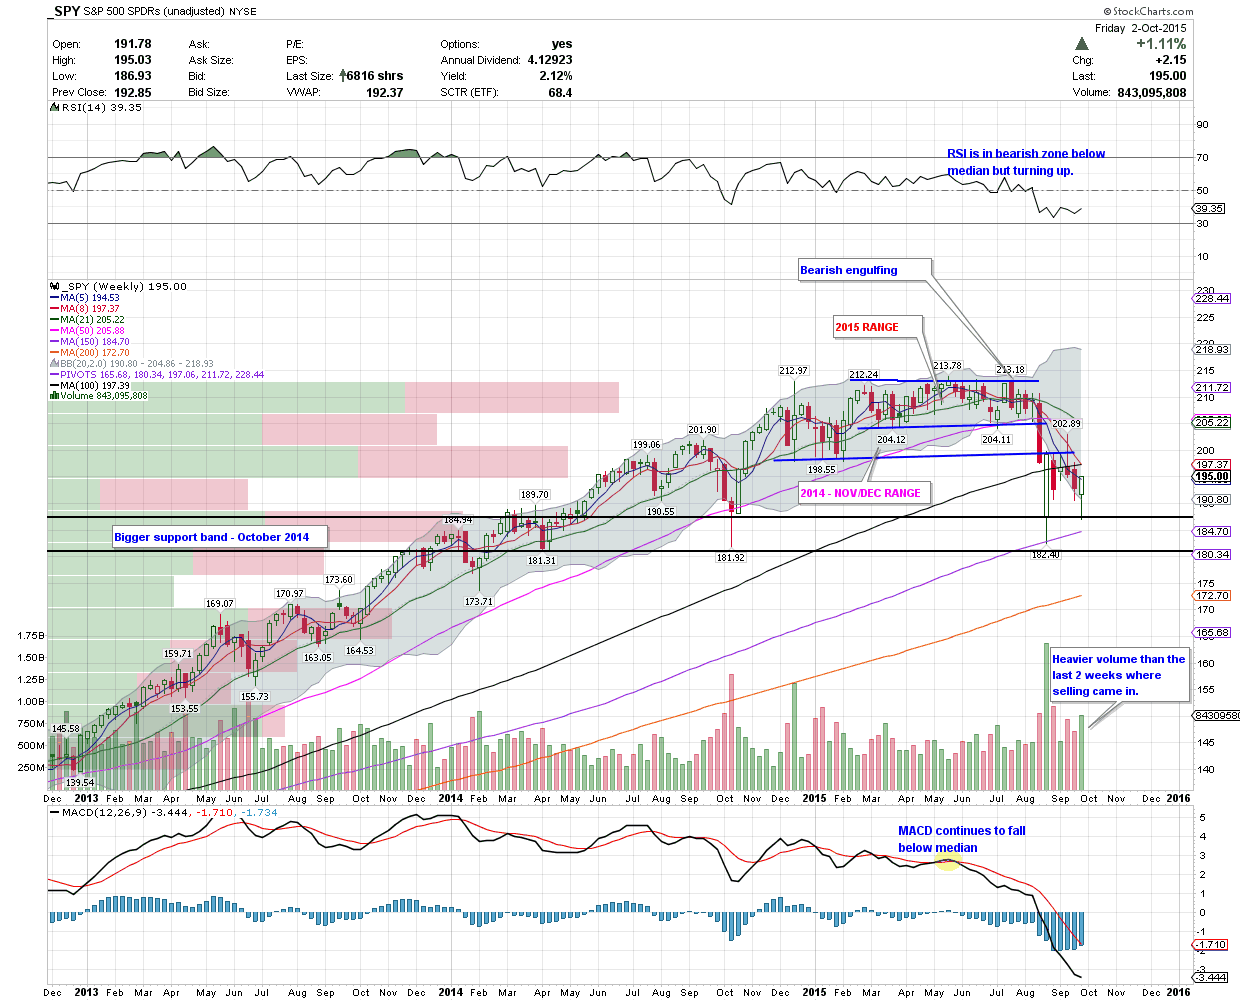
SPY Weekly Timeframe:
On the weekly timeframe, SPY printed a Hammer last week but needs confirmation higher next week. But do note that price is still below declining MAs. RSI is bearish but trying to turn. MACD – no respite. Still falling. Slow STO also is not confirming the move last week. Needs to turn higher and go above median. Very mixed picture. click to enlarge
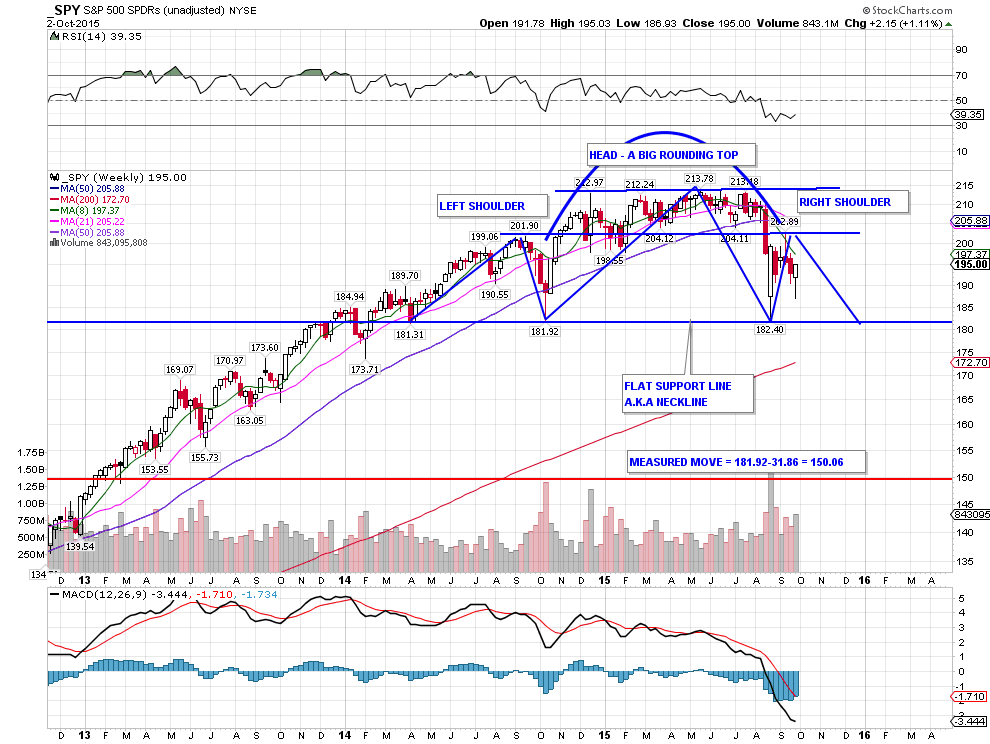
One last thought on a chart formation I’ve been watching: A possible Head and Shoulders pattern. The Right shoulder is still getting built and the Head & Shoulders Top is getting more pronounced now. The next leg lower could potentially start once buying is exhausted (perhaps near the 199-200 zone). A breach below Friday’s lows of 189.12 would confirm the start the next leg lower towards 180, in my opinion. But this is all speculation until it actually happens.
Thanks for reading and have a great week. You can read more of my weekly analysis on my website. Thanks for reading.
Twitter: @sssvenky
Position in SPX at the time of publication. Any opinions expressed herein are solely those of the author, and do not in any way represent the views or opinions of any other person or entity.

 Flirting With Critical Support… Again")


