The U.S. stock market indices continue to swing back and forth as the correction in equities continues to play out. Today I provide an update on several indicators across the broader market.
Key Stock Market Correction Takeaways:
– Breadth trends deteriorating
– Look for improving momentum before getting more constructive
– Evidence of pessimism but long-term sentiment not yet unwound
This week’s market action is challenging the view that the move off of the February stock market peak is working toward a swift conclusion.
As selling intensified last week, the emerging consensus seemed to be that volatility and weakness would emerge quickly and the entire episode would quickly run its course. While volatility may ebb, at this point the emergence of an uncertain trading range seems more likely than a sustained move toward the February highs.
As we will explain, longer-term breadth trends (including the percentage of industry groups in up-trends) continue to deteriorate and downside momentum remains intact. While we have seen some evidence of a near-term re-set in investor optimism, it has been uneven. A more complete unwind in longer-term sentiment may be needed.
We are encouraging investors to remain patient in the face of the recent volatility. It is important to see downside momentum break before taking a more constructive near-term view on stocks. While the S&P 500 rallied more than it has sold off this week, breadth has been more bad on down days than it has been good on up days. Sustainable lows for the indexes tend to be accompanied by improving trends beneath the surface.
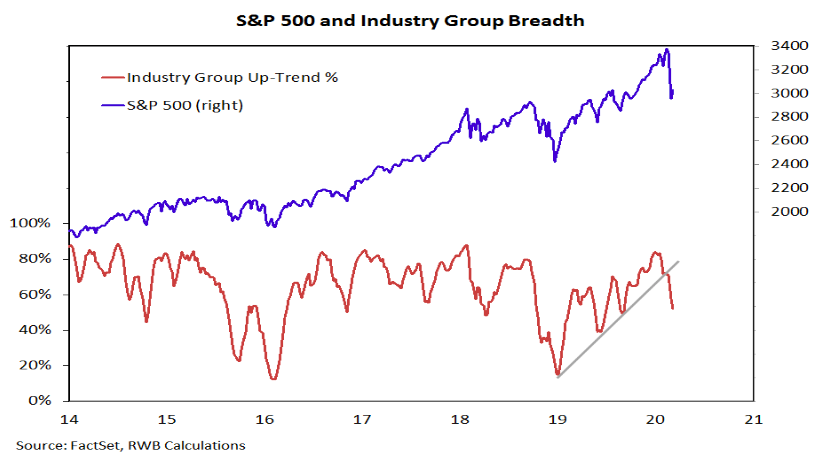
Industry group trends turned sharply lower last week after failing to confirm the S&P 500 highs in February. Sector-level trends also weakened and (perhaps not surprisingly) are about as negative as they get. Rally attempts that level our sector-level indicator in negative territory are unlikely to be lasting. We publish updates to these indicators in our Market & Sector Trend Summary report (published every Monday).
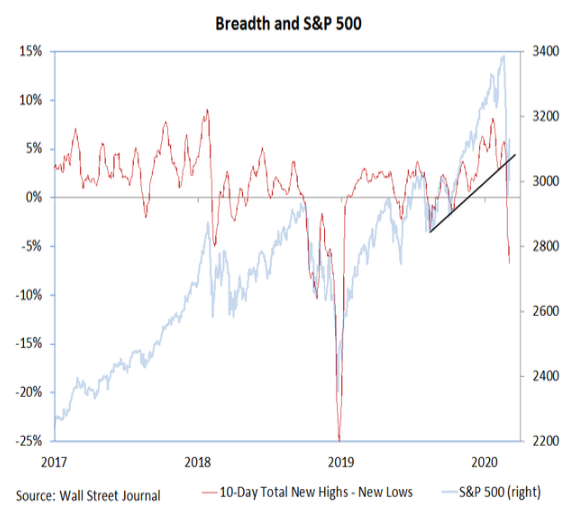
The trend in net new highs is further evidence of deteriorating broad market trends. On a daily basis, new lows stabilized early this week, but today are again expanding. The Dow Jones Transportation Index is also making a new 52-week low and is trading at a level last seen in January 2019.
Short-term breadth indicators did reach some extreme levels last week. Coming into this week, less than 5% of S&P 500 stocks were trading above their 50-day averages and only a quarter were above their 200-day averages. At this point that appears to be evidence more of weakness than selling exhaustion.
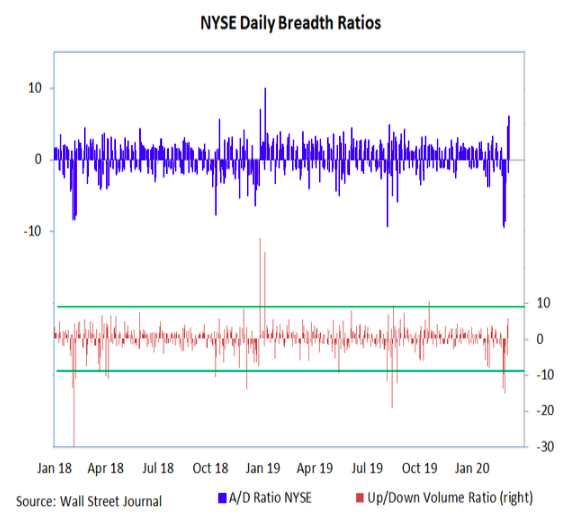
As we mentioned, index-level rallies this week were not confirmed by strength beneath the surface. Twice this week the S&P 500 rallied more than 4% but on neither day did NYSE upside volume outpace downside volume by better than 9-to-1 and cumulative breadth indicators lagged the indexes. We are looking for at least two 9-to-1 up-days to gain confidence that downside momentum has been exhausted.
As we discussed in last week’s Market Commentary, prior to seeing upside breadth thrusts, we have been looking for signs of near-term selling exhaustion. The spike in the TRIN this week above 2 helps in that regard. Importantly, however, we see this more as a necessary than a sufficient condition to suggest that near-term lows are imminent.
We have also seen evidence that investors have turned more cautious. Demand for put options has sent the 10-day put/call ratio to its highest level in over a year. The NDR Crowd Sentiment Poll moved into the excessive pessimism zone, but remains shy of its previous extremes.
While maximum pessimism can be bullish for stocks, expanding pessimism tends not to be. The best opportunities to get more bullish come after the crowd reverses at an extreme (i.e., optimism is rising after pessimism has become excessive).
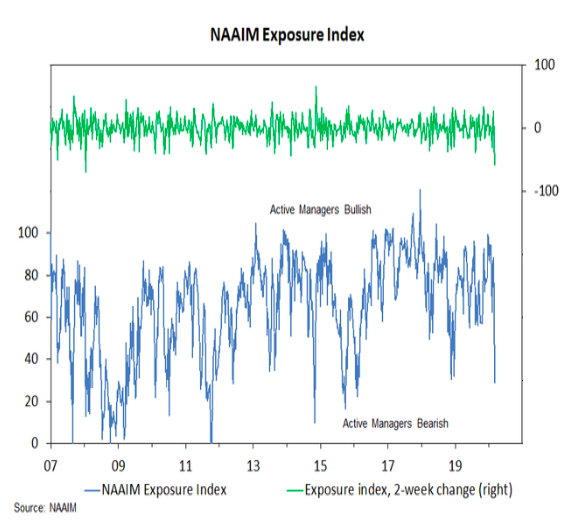
Identifying peak pessimism is difficult to do in real-time. The sharp decline in this week’s NAAIM Exposure index (lowest level since January 2016 and largest two-week decline since 2008) suggests longer-term unwind in sentiment may be in store. That would suggest that data from Investors Intelligence (which still shows twice as many bulls as bears) and the AAII (which showed bulls increasing this week) may not yet be at peak pessimism.
Twitter: @WillieDelwiche
Any opinions expressed herein are solely those of the author, and do not in any way represent the views or opinions of any other person or entity.


