The stock market rally has gotten overbought – Is this a sign of further momentum or of the end-game?
There are many ways to determine overbought and oversold conditions in the stock market. We recently took a look at the overbought nature of the market from a long-term, 30,000-foot perspective.
Today, we look at things on a shorter time frame, considering the status of the post-December bounce.
Most people would likely agree that after a 15% rally in the S&P 500 (SPY) in about 6 weeks, this bounce has gotten overbought.
One way of determining just how overbought the market is is by looking at various measures of momentum, e.g., the relative strength index, or RSI. Generally, a reading above 70 is considered “overbought”. A few days ago, the SPX registered a high RSI (14-day) reading of 67.5.
Considering the depths from which the indicator was recovering, that’s close enough to “overbought” for us. That is especially true given the unusual circumstances surrounding this reading – specifically, the fact that the index is still trading below its 200-day simple moving average.
How unusual is this? Going back to 1965, or more than half a century, there have been over 13,600 trading days. Just 58 of those days saw the SPX below its 200-day moving average while the RSI was over 67. Of just the 4200 days during that period when the index was below the 200-day moving average, 58 represents just 1.3% of those days.
So is this a good thing or a bad thing? We’ve heard a lot of commentary lately that this is a “good overbought” reading as it suggests further momentum going forward – and there is solid evidence to back up that assertion. However, considering the fact that the index is below the 200-day moving average, we also have to wonder if it is merely an overbought reading in an ongoing downtrend. What does history tell us?
This chart shows the prior instances of such conditions over the past 54 years.
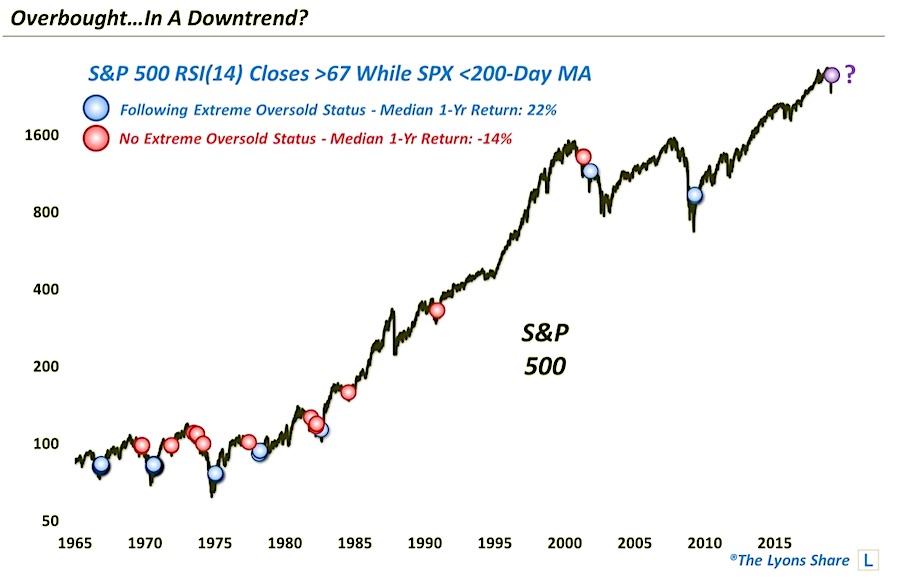
As the chart indicates, most of the historical events took place within a secular bear market. That’s not surprising since the SPX is below the 200-day moving average more often during such markets. The chart also indicates that some of the readings have preceded good returns and some have preceded awful returns. What is the determining factor?
We found that in instances where the market was coming off of an extreme, longer-term oversold condition, this signal generated consistently good longer-term returns, a median 1-year return of +22% to be precise. However, following signals where our extreme oversold condition was not satisfied, 1-year median returns were an abysmal -14%.
So into which category does our present case fall? We take a look in a post at our “all-access” site, The Lyons Share. If you are interested, we invite you to check out the site. Thanks for reading!
Twitter: @JLyonsFundMgmt
The author may have a position in mentioned securities at the time of publication. Any opinions expressed herein are solely those of the author, and do not in any way represent the views or opinions of any other person or entity.

: Cup (and Maybe Handle) Watch")
 Reaches Important Price Support")

