Here’s a look at some key stock market indicators, charts, and themes that we are watching.
This Week’s Stock Market Outlook:
Indexes Churning – After an initial bounce off of last week’s lows, stocks have swung between gains and losses at sometimes dizzying rates. The day-to-day changes seen over the past week are reminiscent of the week-to-week swings seen last summer. The risk now is that the oversold conditions that helped the initial bounce will resolve through time without stocks making much headway.
Caveats on Sentiment – While pessimism is widespread, it is hard to tell in real-time whether a true extreme has been reached. We won’t know for sure until it has meaningfully reversed. Recent experience suggests we may be at an extreme, but the historical record argues that there is room for even more pessimism.
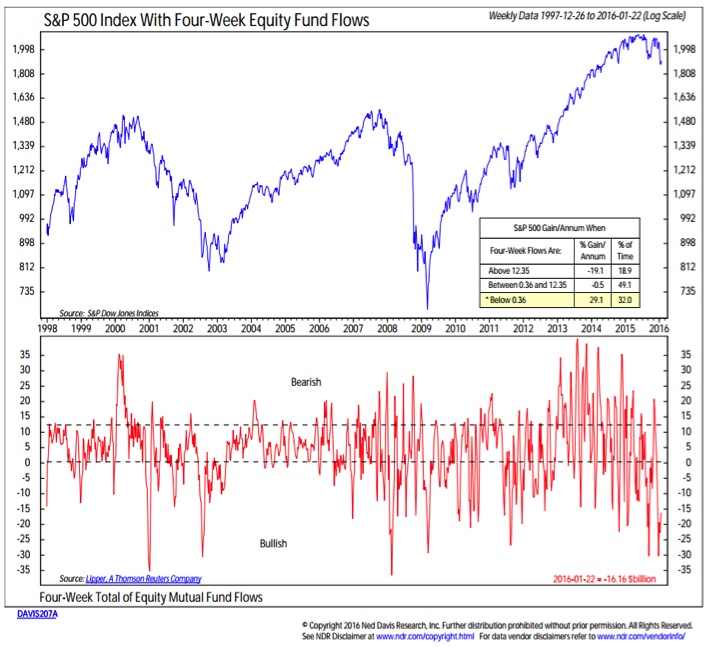
Asset Allocation Shift Underway? – Household portfolios have gotten excessively exposed to stocks and historically under-exposed to cash. Fund flow data suggests this may be reversing. Equity funds are seeing outflows and money market funds are seeing inflows. If this asset allocation shift continues, it would be a headwind for stocks in the near term, but could lay the foundation for a more sustainable rally to ultimately emerge.
Stock Market Indicators – Indices & Sectors (click to enlarge)
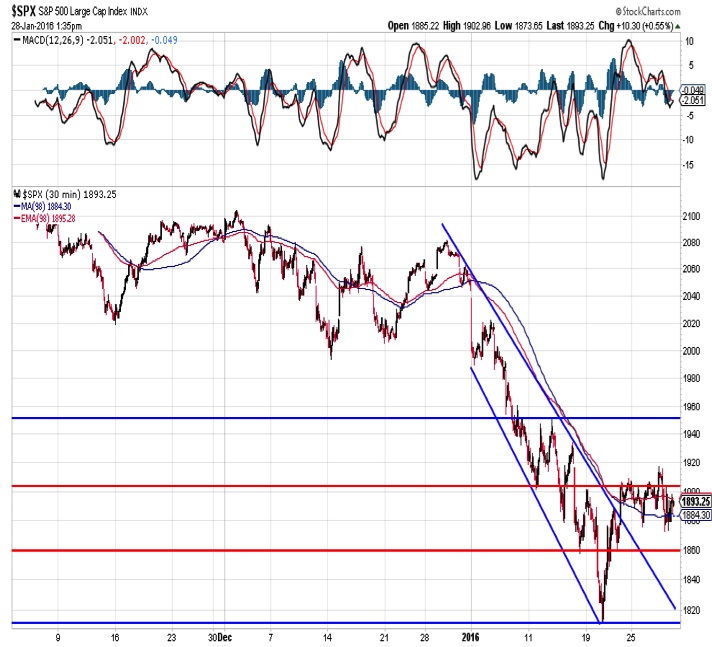
S&P 500 Index
After beginning the year with a definite downward bias, stocks have stabilized somewhat over the past week. Day-to-day swings remain large (and comparable to the week-to-week swings seen just before last year’s August swoon), but on a very short-term basis the trend has stopped falling. The hoped-for oversold rally has been relatively lackluster and has thus far failed to produce any meaningful follow through.
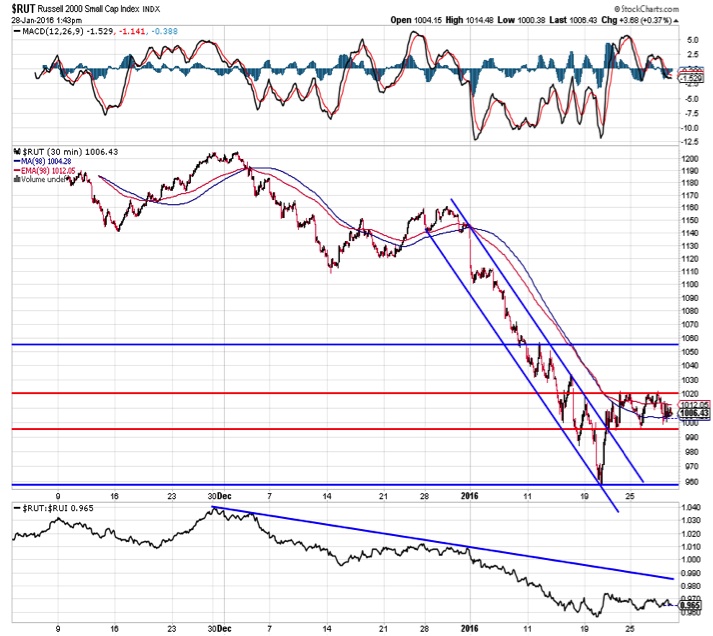
Russell 2000 Index
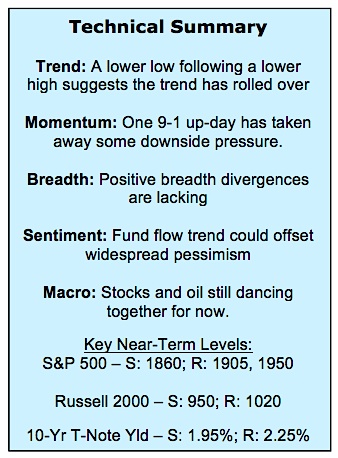
The patterns for both the S&P 500 and the small-cap Russell 2000 have been similar. An oversold bounce that broke the down-trend that has since failed to go anywhere (although it has gotten there quite quickly at times). The risk for both indexes is now similar – oversold conditions are being worked off through time and the longer-term trends remain to the downside. A sustained break above near-term resistance (1905 on the S&P 500 and 1020 on the Russell 2000 would suggest this bounce has further to run. A failure at support would suggest otherwise.
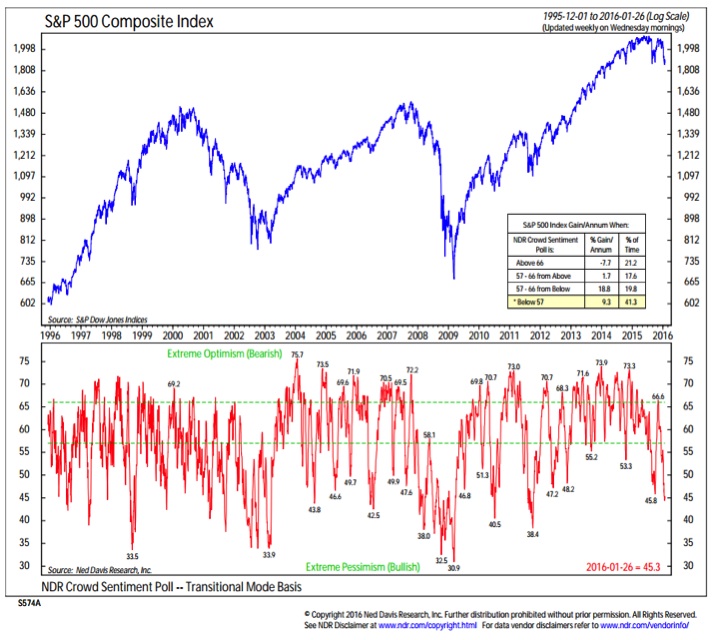
Investor Sentiment
Investor pessimism remains relatively widespread. As the NDR Crowd Sentiment Poll shows, relative to the recent past we are at excessive levels of pessimism. But even as recently as 2010 and 2011 we have seen further extremes in pessimism. The risk in using sentiment indicators on a real-time basis is that you do not know for sure that you have reached extreme readings until they meaningfully reverse. While sentiment is at levels that have produced rallies in the past, nothing is guaranteed. In the current case we have seen some evidence already that investors are already turning more hopeful (or at least less bearish). It feels like it could be too early for that to be considered a good sign.
Equity Flows & Asset Allocation Shift
In terms of investor sentiment, it is important to balance how investors say they feel or are allocated (via the surveys) against their actions, as seen through fund flow and asset allocation data. Equity funds continue to see significant outflows, a condition that has been historically a bullish indicator. Stocks overall tend to rally once investors are actually pulling money out of equity funds.
continue reading on the next page…
: Creating Bullish Divergence?")


 and Semiconductors (SMH): Concerning Price Pattern?")


