Overall GDP growth was a disappointing 1.2% in the second quarter. This was an uptick from the first quarter numbers, but still fell shy of expectations. We have seen evidence in the monthly data that business conditions improved over the course of the second quarter, but the draw-down in inventories continues to weigh on GDP. The effect from inventories has been a headwind for GDP growth in each of the last five quarters and the most recent quarter saw an outright contraction in inventories for the first time since 2011. While a headwind for over a year, we are now in a position where inventories could be a tailwind for growth over the second half of 2016 and into 2017.
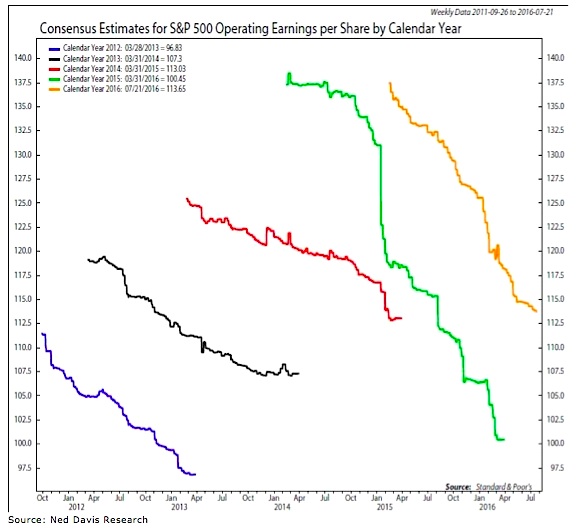
Valuations remain bearish. The rally to new price highs has not been accompanied by a commensurate move higher in earnings. We are however, getting to the point where the rate of decline in earnings is slowing and the earnings reports that have been seen for the second quarter have not been quite as bad as analysts were expecting. A slower rate of descent can be a harbinger of an actual ascent and expectations are for better earnings in the second half of 2016. The pattern of the past few years speaks volumes, however, about putting too much faith in earnings expectations.
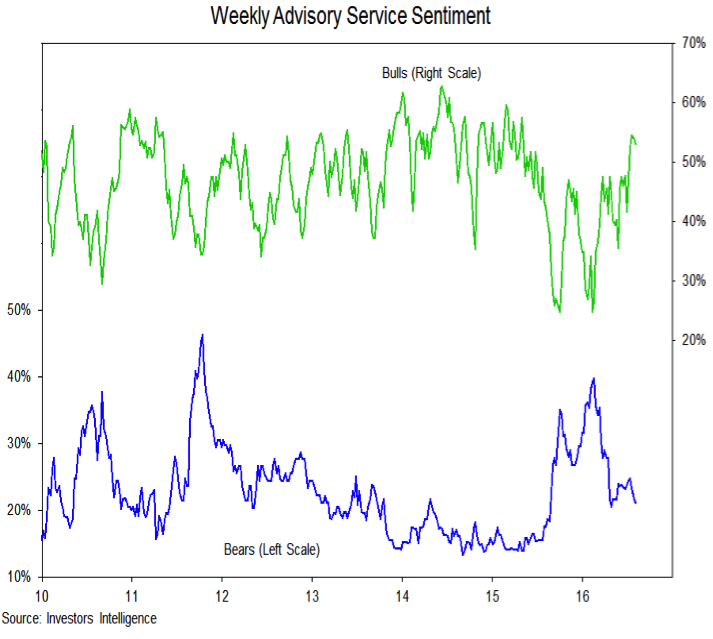
Sentiment is neutral. A number of our short-term sentiment indicators (which we actively track in our Weekly Market Notes) show that excessive optimism has accompanied the rally to new price highs. This has made near-term upside more hard fought and helps explain (from a contrarian perspective) the emergence of the current consolidation phase. It remains to be seen whether recently converted bulls will stay hopeful if stocks stall in the near-term. In terms of the weight of the evidence, we have a close eye on the advisory services sentiment data that is published weekly by Investors Intelligence. Bulls have increased, but the bearish contingent remains well-above the lows seen in 2014 and 2015. A sharp drop in bears could shift sentiment overall into a more bearish mode.
Seasonal patterns and trends are neutral. As we discussed above, there is evidence that a longer-term up-trend is emerging after 18 months of consolidation. For now, however, the seasonal pattern argues for a little more caution. Per Ned Davis Research, history suggests that when the incumbent party wins stocks have tended to rally between the conventions and the election, while a loss by the incumbent party has been associated with stock market weakness in that time period. The current election cycle has had enough twists and turns to keep us skeptical that we are passed the point of surprises. Moreover, the annual seasonal pattern suggests investors should brace for weakness in August and September. Clarity around the election outcome could help stocks rally in the fourth quarter.
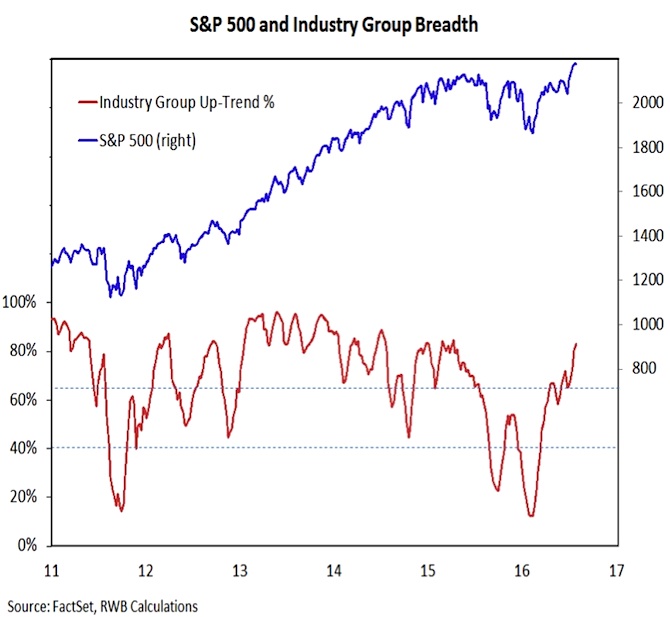
The tape (breadth) has turned bullish. The contrast in the behavior of the broad market between 2015 and 2016 could hardly be greater. Last year, just a handful of stocks were supporting the popular averages, while this year the average stock is doing better than the popular averages. Last year the percentage of industry groups in up-trends contracted on each rally attempt, while this year we have seen a dramatic expansion in the percentage of groups that are trending higher. There remain areas that skeptics can lean on – small-caps have yet to make new highs, the Transports have not confirmed the strength in the Industrials, and Financials have not moved into a leadership position. Overall, however, breadth looks bullish and is likely to remain a support for the popular averages in the months ahead.
With the weight of the evidence bullish, tactical investors may want to use any near-term pullbacks to increase exposure to areas of the market that are in relative up-trends.
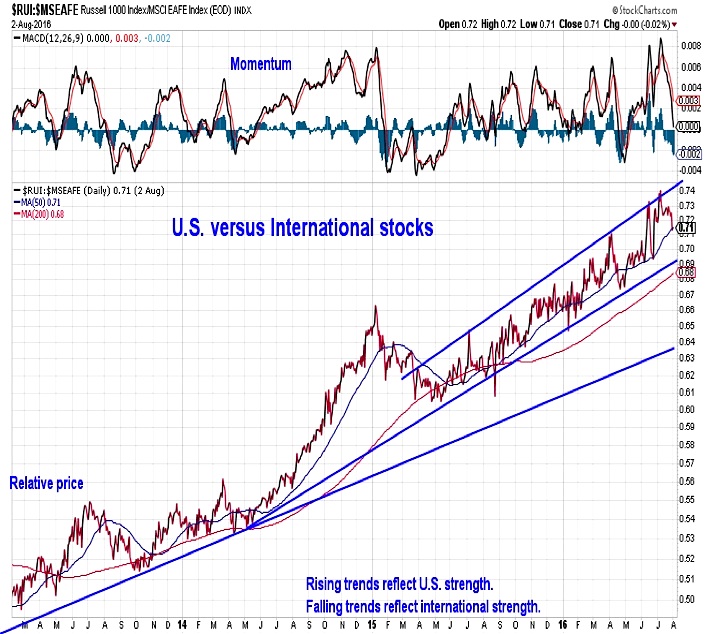
U.S. stocks continue to work higher relative to international stocks, and small-caps (and mid-caps) are gaining the upper hand relative to large-caps
Bond yields collapsed in the wake of the Brexit vote and have yet to recover, despite better-than-expected economic data and an apparent increase in risk appetite among investors. Optimism in bonds remains excessively high, and if the attention moves toward better growth and stable to higher inflation, bond yields could make a sustained move higher. We would continue to have underweight exposure to bonds.
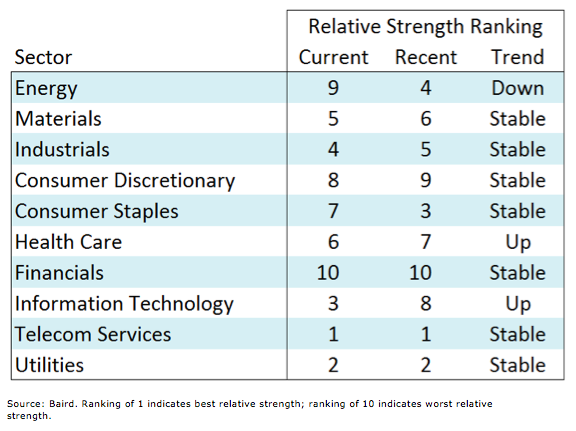
Sector leadership has been volatile on a week-to-week basis.
Utilities and Telecom have remained near the top of the rankings, but are expensive and could be vulnerable if bond yields do move higher.
Industrials and Materials have settled on the fringe of leadership, but are well-positioned if business spending does accelerate in the second half of the year.
Energy has been hurt by the recent correction in the price of oil.
Health Care and Technology are seeing improving trends and could be poised to move into the leadership ranks going forward.
Thanks for reading.
Twitter: @WillieDelwiche
Any opinions expressed herein are solely those of the author, and do not in any way represent the views or opinions of any other person or entity.

: Showing Some Signs of Emerging Strength")
