Our hearts go out to the victims and families of those who have died or became inflicted with the Coronavirus!
After seeing headline after headline on the expanding impact that the virus is having throughout the world, that impact extended to the global markets.
We have often talked about the technicals preceding the fundamentals.
And as much as we hate hearing about suffering, before the virus news became the headliner, there were signs of stress in the stock market already happening.
For example, I wrote about the Regional Banks ETF (KRE) and how once it broke the 50-day moving average and went into a caution phase, that merited a head’s up to the bulls.
I also wrote about junk bonds and investor appetite for risk. I warned that should the Junk Bonds ETF (JNK) break below 110.00, which it did, it was time to be cautious.
Furthermore, we talked about the commodities markets, especially the metal miners and metals, yet another warning, all of which when NASDAQ made new all-time highs, remained in bullish phases.
Then, we pointed out that all the economic Modern Family members except for Semiconductors SMH, were having inside weeks (when the trading range of the current week is inside the trading range of the week before-the outside week.)
And finally, I added the volatility index to the list of ETFs and recorded that a move over 13.56 saw volatility’s return above the seasonal low.
Interestingly though, not everyone failed the outside week low.
The holdout or the one who closed out this week still inside the prior week’s trading range?
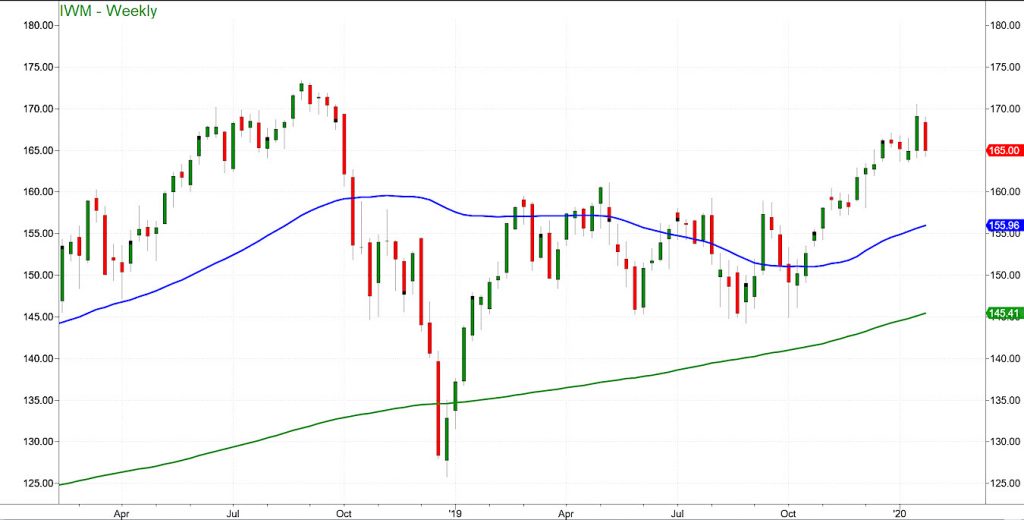
Here is the weekly chart of the Russell 2000 IWM.
IWM is our Granddad of the economic Modern Family and the best indication of the manufacturing or supply side of the U.S. economy.
164.07 was the low the week ending January 17th.
This week’s low was 164.23.
Moreover, IWM on the daily chart is holding the 50-daily moving average or 163.66.
That support between 163.66-164.07 becomes critical for the upcoming week.
With the 2018 high of 173.39 and the 2020 high of 170.56, we have two different but both extremely valid scenarios to watch for.
First scenario supports what I came into this year predicting could happen. Then, as we enter the Year of the Metal Rat, the first scenario also supports what Raymond Lo predicts.
For different reasons we both agree that the market could decline this year.
He relates it to the elements, the death of fire, and the abundance of water- all bearish.
I relate it to central bank policy, tariffs and diminishing manufacturing numbers. In my scenario, this year brings stagflation or rising commodity prices and falling equity prices.
However, the second scenario that we all must keep an open mind to, is that this correction, no matter what the catalyst, is a buy opportunity.
If so, the Russell 2000 could soar above the 2018 high and see its way to new all-time highs.
This coming week, we must watch the support levels in IWM to hold or not.
If those levels hold, then IWM survives some demolition, with the bones intact.
Please have a listen to my interview last week with TraderTV.com
S&P 500 (SPY) had a distribution day in volume and broke the 10-day moving average at 329.53; this is now pivotal.
Russell 2000 (IWM) has price support between 163.66-164.07. The ETF had an inside week and faces price resistance at 167.14
Dow (DIA) Inside week. The 10-day moving average at 290.80 broke and is now pivotal. 288.14 is the weekly low to hold this week.
Nasdaq (QQQ) held its 10 day moving average at 221.97 despite putting in a nasty candle and distribution in volume.
KRE (Regional Banks) 55.00 is the next price support as this decidedly broke its 50 day moving average.
SMH (Semiconductors) is still the strongest sector. 145.75 is pivotal price support.
IYT (Transportation) 195 is major support with 200 being a pivotal level to watch.
IBB (Biotechnology) unconfirmed caution phase with 118.86 being pivotal price resistance. 115.40 is price support.
XRT (Retail) Unconfirmed caution phase with 45 being pivotal price resistance.
Twitter: @marketminute
The author may have a position in the mentioned securities at the time of publication. Any opinions expressed herein are solely those of the author, and do not in any way represent the views or opinions of any other person or entity.


: Important Breakout Retest")


