A secret meeting that led to the formation of the Federal Reserve occurred on Jekyll Island, Georgia in 1910. Such an appropriate location for what has become the Jekyll and Hyde FED. One day we hear that they are ready to tighten, the next day it’s low rates forever.
Well Jekyll & Hyde can also be used to describe the recent stock market action. From dead quiet to rip roaring excitement basically overnight. As far as the Federal Reserve goes, I don’t care nor project what it will do next. It doesn’t matter in my work. I am happy/relieved that we finally got the pullback in the S&P 500 (INDEXSP:.INX) and other major indices that I have been impatiently waiting for.
The media tells us why the stock market is going down, pinning the latest news headline or market development to declining prices. So a quarter point hike in the fed funds rate is responsible for one of the nastiest market days in quite a while? A very minor breakout in Treasury yields is responsible for this? I don’t think so, but the reasons do not matter.
My take: Sentiment for stocks was at bullish extremes after a rocket ride off the late-June lows. And this needed to be reset. This was accompanied by the fact that the S&P 500 was up almost 300 points from its February lows. As well, it was dealing with round number resistance at 2,200. As I have proffered before, the faster the market declines, the faster sentiment resets… and the faster we find a market bottom.
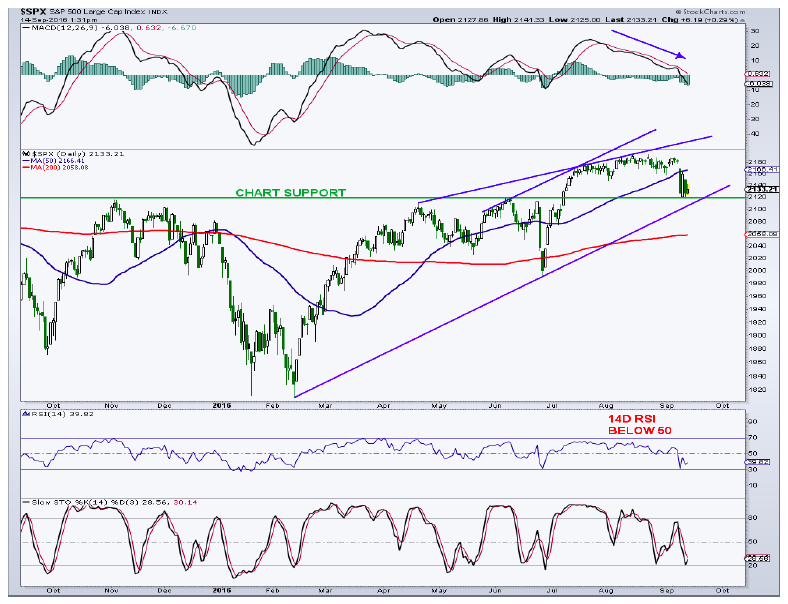
I have been looking at the 2,100 to 2,135 area on the S&P 500 as a potential pullback target for while now. And so far, chart support in the 2,120 region has held. When we see this kind of price velocity, however, it would be very easy to slip right through this region and see more damage than I had expected. Below 2,100, the next potential zone of support is down near 2,060. This is the location of the 200-day average as well as a 61.8% retracement of the rally from late June.
There were certainly some signs of minor capitulation on Friday and Tuesday. This transpired in extreme readings in the NYSE Arms Index, the NYSE cumulative TICK, the equity-only put/call (p/c) ratio, the ISE call/put ratio, the NYSE advancing issues ratio and the Nasdaq advancing issues ratio.
The Arms Index or TRIN is a breadth indicator comparing advancing and declining stocks on the NYSE with rising and falling volume on the NYSE. Low levels of this indicator (below 1) show strong advancing vs. declining volume, a bullish sign, while levels above 1 show the opposite. The Arms Index sometimes goes to extremes, especially during weak market days with readings above 2.5. On Tuesday, TRIN closed at 3.17, the most oversold since mid December. That was not a good oversold, buy the market sign. Of course it depends on what type of market you are in. During 2013 and 2014 when the market was trending higher, as it is now, readings above 2.5 were mostly all associated with pullback lows. We shall see if this works again.
The equity-only put/call ratio rose to 0.75 on Tuesday, after hitting 0.78 on Friday. This ratio generally oscillates between 0.5 and 0.75 so it pushed into pessimistic territory. During major market corrections, this put/call can easily exceed 1.0 so we are not in ultra pessimistic territory but the market hasn’t corrected much either. The ISE call/put ratio fell to a pessimistic level on Tuesday, mirroring the equity-only put/call.
The NYSE advancing issues ratio (advances/advancers + decliners) fell to an extreme low level on Tuesday of 11% after hitting 6% on Friday. Yes, like the Arms Index, this is a measure of market breadth, but I include these measures in my sentiment discussions when we see a clear washout decline. Believe it or not, these two readings were the lowest and most lopsided since August and September 2015. This is called throwing the baby out with the bath water. When this market indicator becomes oversold during a sustained uptrend, it suggests an upside reversal is not far behind. We shall see.
Conclusion: Near-term, volatility (INDEXCBOE:VIX) is back. I would continue to use a layering approach on any more weakness with 2,120, 2,100, and 2,060 as focus areas to increase equity allocations. Looking out, I see the S&P 500 reaching the 2,300 to 2,500 region later this year or in the first half of 2017.
Thanks for reading.
You can contact me at arbetermark@gmail.com for premium newsletter inquiries.
Twitter: @MarkArbeter
The author has a long position in S&P 500 related securities at the time of publication. Any opinions expressed herein are solely those of the author, and do not in any way represent the views or opinions of any other person or entity.


 Testing Important Price Support")


