What We Are Watching
This Week’s Stock Market Outlook:
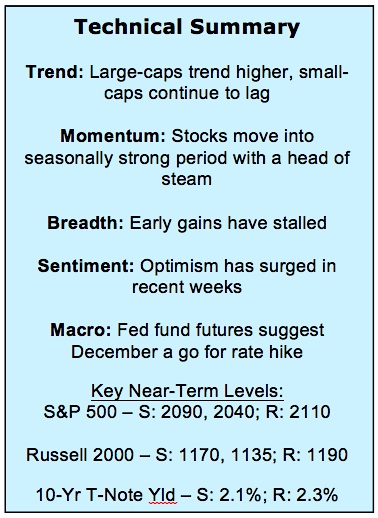
Can Small-Caps Get In Gear – The NASDAQ 100 (has made a new high, and the S&P 500 is just a handful of points away from its May peak. Small-caps, however, have struggled to regain their early-year form and the Russell 2000 is actually still in the red. We may be entering a period of sustained large-cap leadership, but we still need some support from small-caps to help sustain the rally.
Broad Market Improvement Needs Further Follow-Through – Market breadth indicators offered evidence of positive divergences as stocks bottomed in late September, but the broad market has failed to produce the sort of follow-through that would suggest the rally is firing on all cylinders. The lack of new highs at the issue level has been particularly noticeable.
Optimism Getting Frothy – After remaining subdued during the early stages of the October stock market rally, optimism has become much more pronounced over the past several weeks. Composite sentiment indicators from Ned Davis Research (the Trading Sentiment Composite and Crowd Sentiment Poll) have moved into excessive optimism zones. Some near-term price consolidation could help take the edge off.
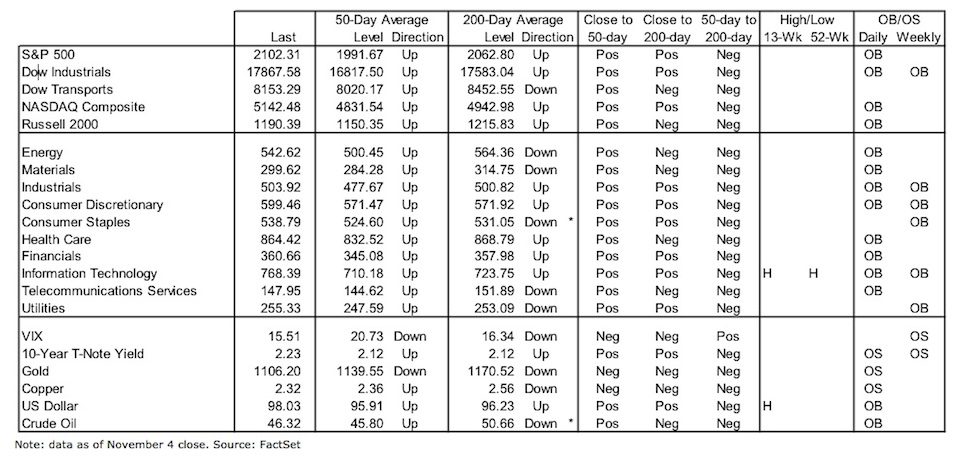
Stock Market Indicators – Indices & Sectors (click to enlarge)
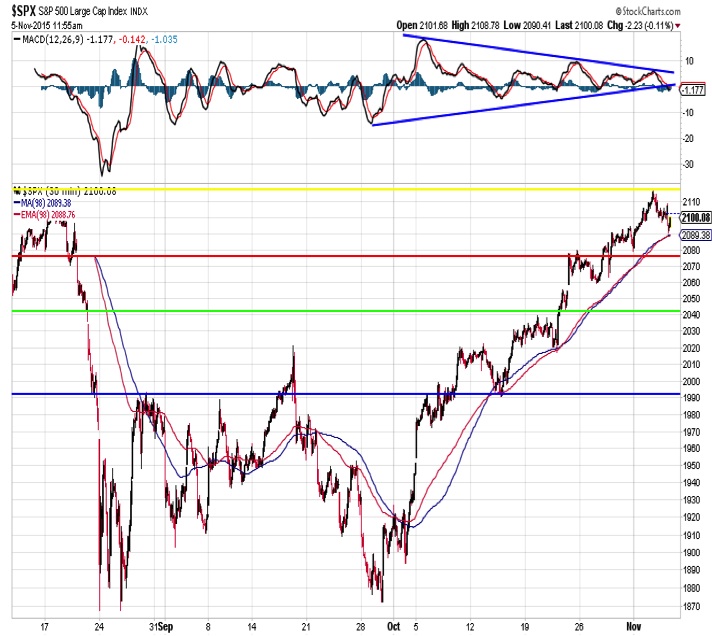
S&P 500 Index
The daily price charts have shown strong upside momentum emerging over the course of the October stock market rally, and that bodes well for stocks into year-end. The intra-day chart shows that momentum has been waning. That could set up some price consolidation as we move further into November. This would be welcome if it allows market breadth to catch up and optimism to dissipate (more on both of those below). How these shake out will likely weigh on the stock market outlook going forward.
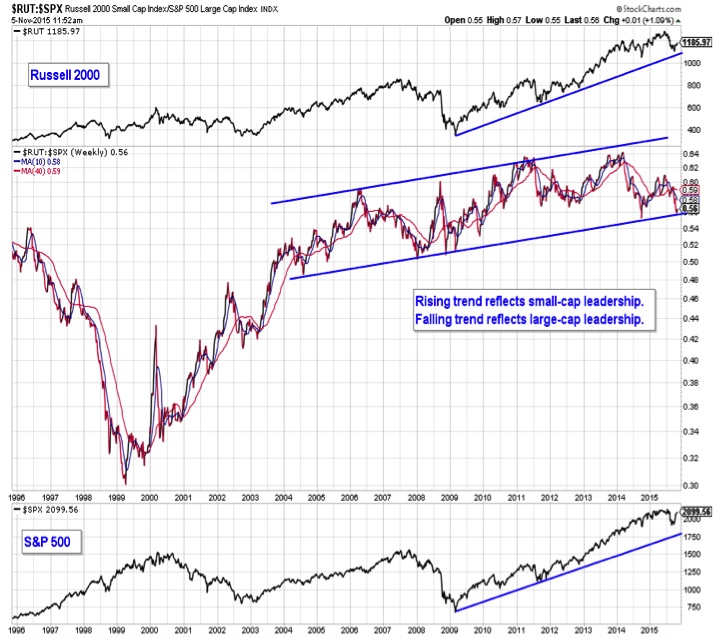
Russell 2000 Relative Strength
The long-term chart suggests we may be at the end of a secular up-trend in small-caps versus large-caps (the ratio between the Russell 2000 and the S&P 500 is at a long-term trend line). History suggests that large-caps can rally even if small-caps are relative laggards. It’s when small-caps show absolute weakness (like in 1998 and 2007) that large-caps struggle.
Market Breadth
Breadth has improved from where it was heading over the first half of the year and where it was during the summer swoon in stocks. Our sector-level trend indicator provided a positive divergence at the September lows, and in early October broke through the series of lower highs that we put in place over the course of 2015. Improvement since then has largely-stalled. After the initial surge, market breadth has shown some evidence of cooling off.

continue reading more on breadth and sentiment on the next page…


