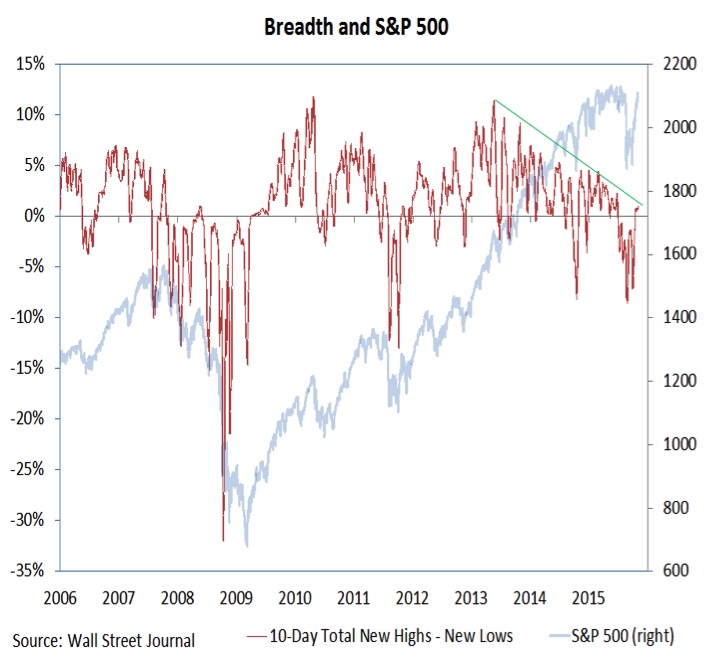
Looking at breadth from the perspective of new highs and new lows, we see a similar story – positive divergences on the September re-test, but little follow-through since. One example: in the final week of October, sitting on top of the gains for the month, nearly as many issues on the NYSE made new 52-week lows as 52-week highs. On the NASDAQ, more issues did make new lows than new highs. Market breadth has improved, but it is not yet back to a bullish mode.
Investor Sentiment
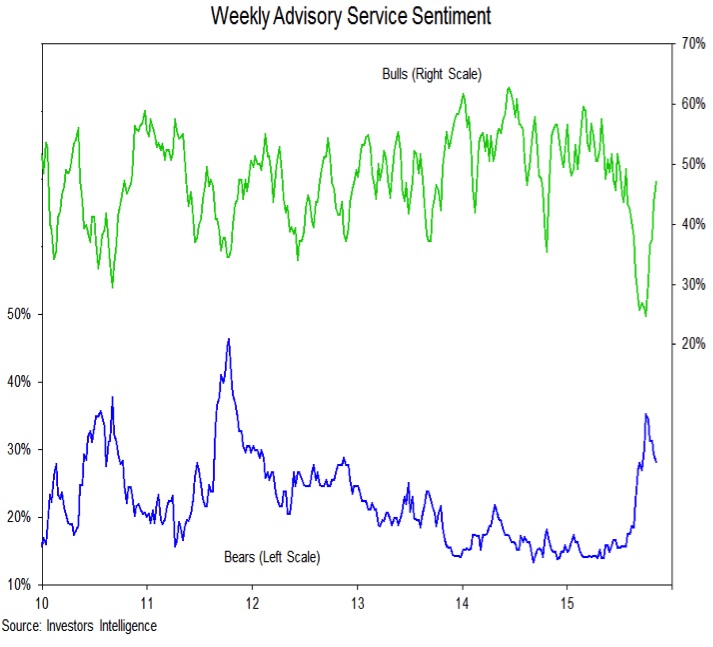
Optimism has really ramped over the past two weeks. Put/call ratios have moved lower and investor sentiment surveys have showed a sharp rise in bulls. The Investors Intelligence survey of advisory services has shown bulls rising to 47% (from a low of 25%). Bears have not reacted in the same fashion, dropping from a high of 35% to 28% this week. The AAII survey of individual investors has shown twice as many bulls as bears for two weeks in a row (39% bulls and 19% bears this week).
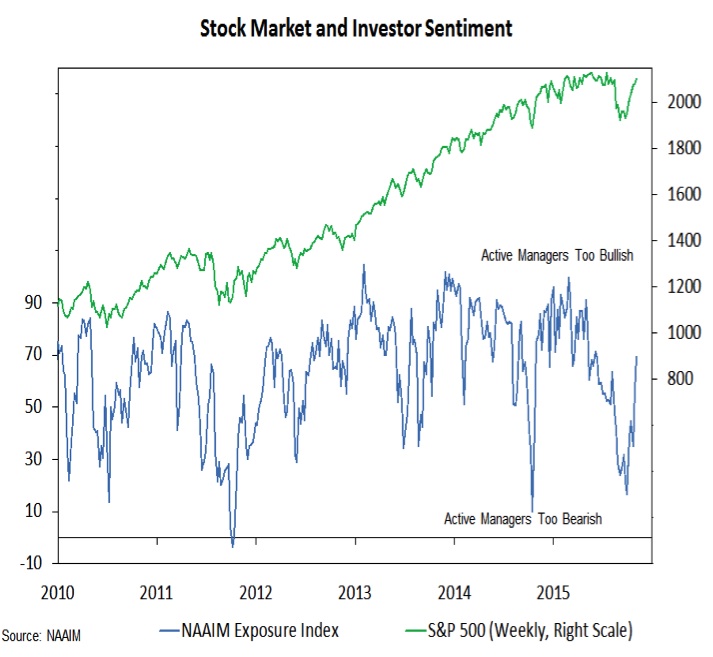
Two weeks ago, we marveled that active investment managers had actually reduced equity exposure (from 44% to 35%) even as stocks were rallying. The have apparently gown more confident over the past two weeks, as the NAAIM exposure index has soared to 69% (its highest level since early June).
At this point, some price consolidation could help take some of the froth off of the investment sentiment indicators and provide a better foundation for a year-end rally (especially if breadth is able to get back in gear).
Utilities Sector In Focus
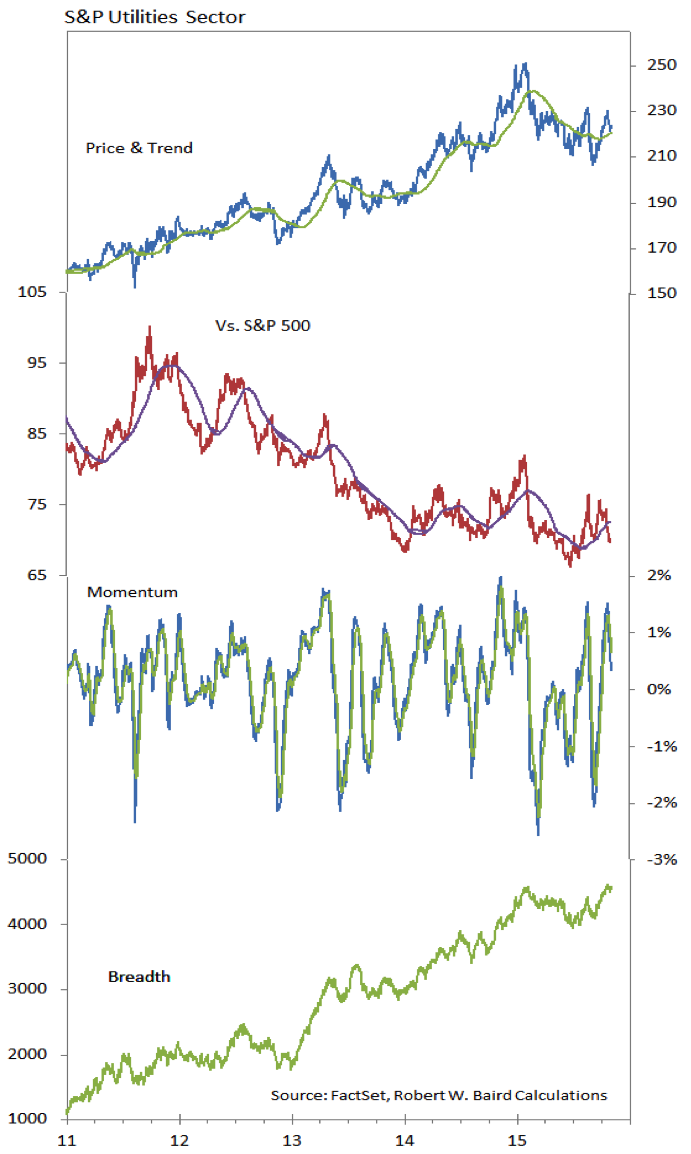
Breadth has held up well in the Utilities sector, but the price action suggests the sector is again falling out of favor. The latest rally was unable to produce new highs on either an abssolute or relative price basis, and momentum now has started to roll over. Our relative strength rankings showed the Uilities sector droppign from second to eighth this past week, as investors have rotated into more cyclical exposure.
Thanks for reading and have a great weekend.
Twitter: @WillieDelwiche
Any opinions expressed herein are solely those of the author, and do not in any way represent the views or opinions of any other person or entity.


