THE BIG PICTURE
Pullback Indeed!
Many have been hoping for a pullback for weeks, and week 10 delivered as stated in last week’s outlook, “key events on the horizon may be just the catalyst we need to pull back and correct the market to its nearest open gaps.” Open gaps may not be the end all to a pullback but surely something to watch if/when the stock market begins to trend lower as we have plenty more to come downside. The market surely has delivered a few moments of uncertainty but just when you begin to think that may be the catalyst needed to pullback, no such luck.
Luck brought us a brief reprieve last week but it was short lived once again on the stock market futures indices. Nasdaq futures (NQ) rose just shy of all time highs on Friday. S&P 500 futures (ES) and Dow Jones futures (YM) were not so lucky as they closed out under their perspective weekly opens. Heads up on the divergence into week 11.
With week 10 behind us and the ever looming non-farm payrolls data out as of last Friday, we remain in a pattern of uncertainty once again as the FOMC announcement approaches. Indices continue to remain on the higher time frame Murray Levels upside in what continues to be an ongoing uptrend holding above each respective 50/144 ema and key moving averages (10, 50, 200). For no other reason than the fact that markets remain upside, even with the pullback noted above, the well monitored moving averages keep my perspective for the short term in the same direction. Once price action pulls back on the 4 hour chart under key noted levels in Week 11’s video outlook, I will default to the daily chart and watch for any price action closing in on the moving averages and daily gaps. Upside action definitely has room as the YM and ES may revisit and retest the all-time highs achieved most recently.
Interesting to note that the VIX Volatility Index (INDEXCBOE:VIX) has remained below 20 for 121 straight days – a streak not seen since 2011. Does this mean things are great/worrisome? I don’t know – who am I to question? As a technical trader, I simply resort to my charts to be ready for both directions and use the Heikin Ashi bars in trend as my indicator.
Looking ahead to week 11, VIX levels remain low and perhaps adding to its already growing number of days below 20 will keep this market afloat and above its perspective moving averages, both on a daily and range charts. Key events in the market this week include FOMC and a heavy duty Wednesday on the economic front. This week also is are quarterly Quad Witching event and all eyes on the SPX 2400 strike calls Open Interest mid month as we may see the ES retesting the upper levels.
The Bottom Line: FOMC is the event to watch. Until then, TREND remains upside as the dips continue to be bought with considerable momentum back to the upside.
Technical momentum probability REMAINS at this point to lead us higher on the indices on the bigger picture if all things remain constant and nothing occurs to “shake things up” downside. However, early signs of weakness have started to show. Watch for the break of the daily 10ma downside or revisiting the all time highs in the opposite direction.
Observe the intraday on the 60/15m charts for any alert of the change in trend or continued movement upside. I will continue notify through social media and my daily outlook; posted 15 minutes prior to the US open of any updates throughout the week.
For the longer term holder, different rules may apply as quarterly re-balancing which is approaching and is my preference for managing such markets. Option to move trailing stops to key MML, Fibonacci or moving average levels can lock in more profit if and when a pullback may occur. Placing a 250 sma/VWAP on your daily/longer term range charts can be one useful indicator before institutional support and taking in more profit.
Note that you can also view my market outlook for ES, YM, NQ, CL, GC, 6J, and 6E on YouTube.
Attempting to determine which way a market will go on any given day is merely a guess in which some will get it right and some will get it wrong. Being prepared in either direction intraday for the strongest probable trend is by plotting your longer term charts and utilizing an indicator of choice on the lower time frame to identify the setup and remaining in the trade that much longer. Any chart posted here is merely a snapshot of current technical momentum and not indicative of where price may lead forward.
NQ – Nasdaq Futures
Technical Momentum: UPTREND
Using the Murray Math Level (MML) charts on higher time frames can be a useful market internal tool as price action moves amongst fractal levels from hourly to daily charts. Confluence of levels may be levels of support/resistance or opportunities for a breakout move.
CHARTS: Daily; Range; 4hr
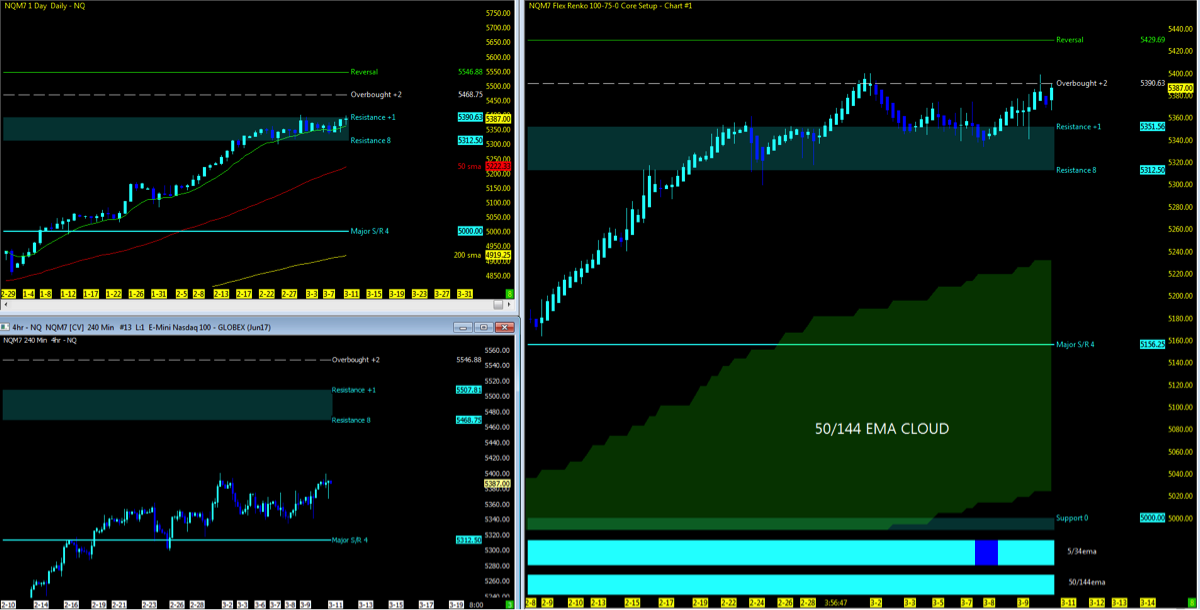
Nearest Open Daily Gap: 5232.5
Lowest Open Gap: 4017
ES – S&P Futures
Technical Momentum: UPTREND
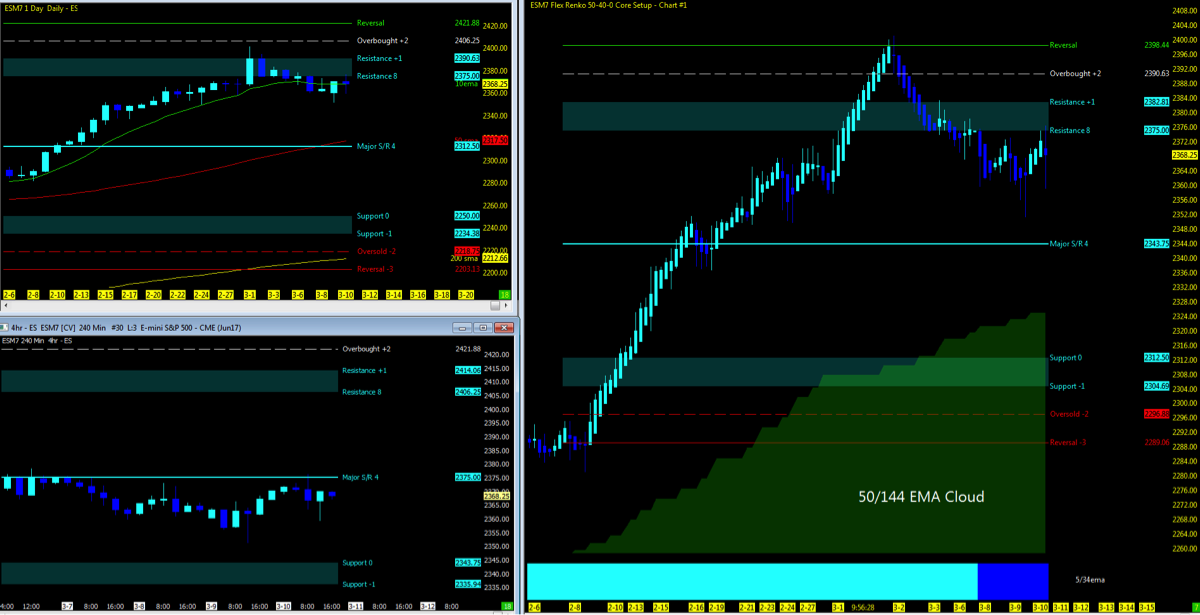
Nearest Open Daily Gap: 2348.75
Lowest Open Gap: 1860.75
Thanks for reading and remember to always use a stop at/around key technical trend levels.
Twitter: @TradingFibz
The author trades futures intraday and may have a position in the mentioned securities at the time of publication. Any opinions expressed herein are solely those of the author, and do not in any way represent the views or opinions of any other person or entity.


