THE BIG PICTURE
Serious Open Gaps!
For weeks now I have been commenting on how relentless the market has been without any durable pullbacks. Even in week 9 the market managed to push up to higher highs once again… but caution remains as key events on the horizon may be just the catalyst we need to pull back and correct the market to its nearest open gaps.
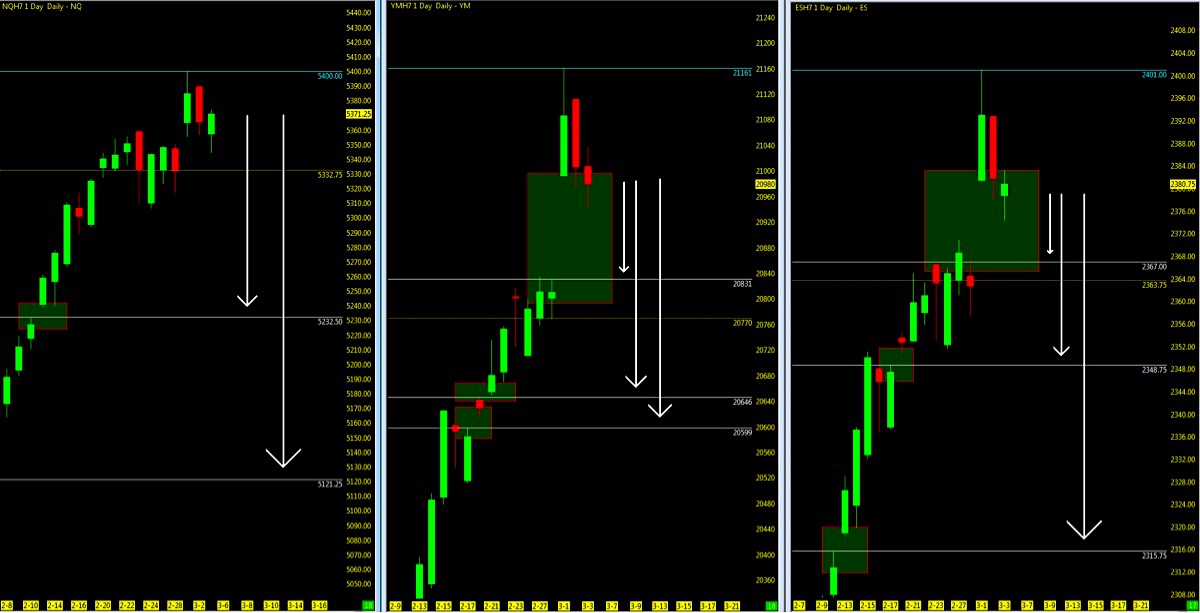
While remaining open gaps may be an entirely another article to write, I mention it here briefly in awareness that the US stock market indices will at some point need to close out “unfinished business” before rallying higher once more.
Now, some of you may disagree with me and that is fine and your right to do so, however when it comes to the indices, 100% of ALL regular trading hour open gaps EVENTUALLY get filled. So I believe you should at least be aware of this (if not prepared) as it WILL happen at some point. It’s not a matter of if, but when. What concerns me more is that while the further we pull away from these lower levels, the drop at one point will be more substantial and “painful”. That said, this will be a fantastic opportunity for the long term trader to average in at lower price. In sum, be mindful of stops and that markets move in both directions.
Week 10 is one step closer to the contract rollover and non-farm payrolls report on Friday. The obvious prospect for a rate hike is enough to put this on a traders radar.
Technically, we remain near the highs after a midweek pullback with serious open gaps remaining below as highlighted above. VIX levels still remain low and almost pointless of indicating when the market will turn as it doesn’t seem to be correlated to one another most recently. The daily charts on the indices clearly paint that picture as we hold above the respective 10/50/200 ma’s. The 4 hour MML charts which support the bigger trend on a lower time frame also remain at the highs and continue to remain in a very tight range. Watch for the SPX 2400 strike calls Open Interest mid month as I can see the ES retesting the upper levels.
The Bottom Line
Until the market shows evidence of distribution, there is only one TREND at this point. There’s a probability of at least a pullback to close out last week’s open gap before moving higher.
Note that you can also view my market outlook for ES, YM, NQ, CL, GC, 6J, and 6E on YouTube.
Attempting to determine which way a market will go on any given day is merely a guess in which some will get it right and some will get it wrong. Being prepared in either direction intraday for the strongest probable trend is by plotting your longer term charts and utilizing an indicator of choice on the lower time frame to identify the setup and remaining in the trade that much longer. Any chart posted here is merely a snapshot of current technical momentum and not indicative of where price may lead forward.
NQ – Nasdaq Futures
Technical Momentum: UPTREND
Using the Murray Math Level (MML) charts on higher time frames can be a useful market internal tool as price action moves amongst fractal levels from hourly to daily charts. Confluence of levels may be levels of support/resistance or opportunities for a breakout move.
CHARTS: Daily; Range; 4hr
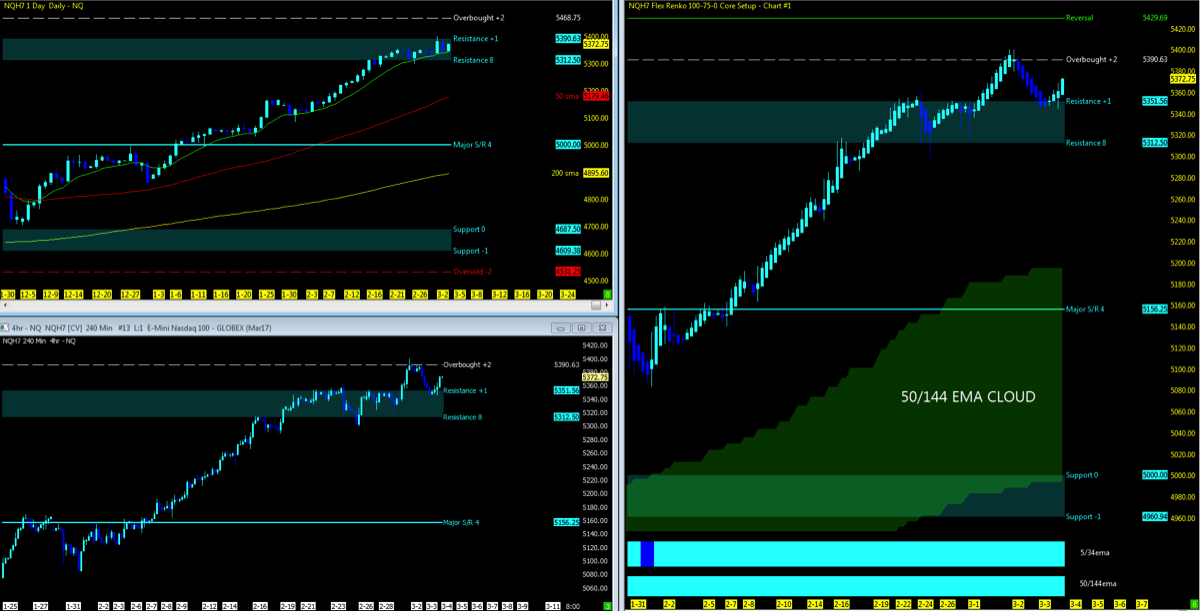
Nearest Open Daily Gap: 5232.5
Lowest Open Gap: 4017
ES – S&P Futures
Technical Momentum: UPTREND
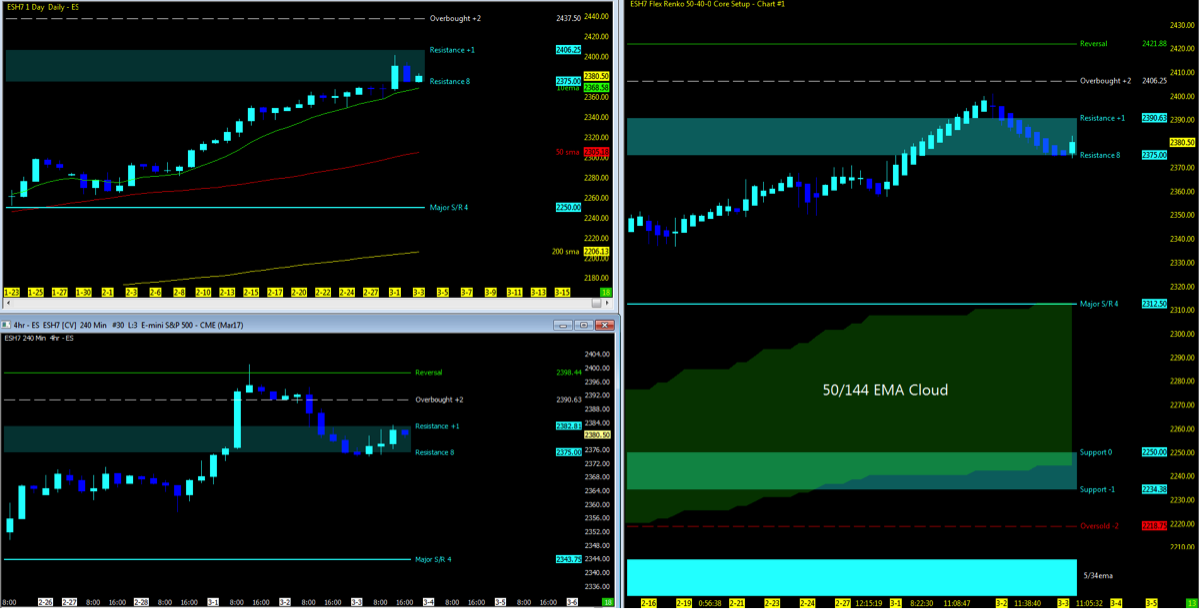
Nearest Open Daily Gap: 2348.75
Lowest Open Gap: 1860.75
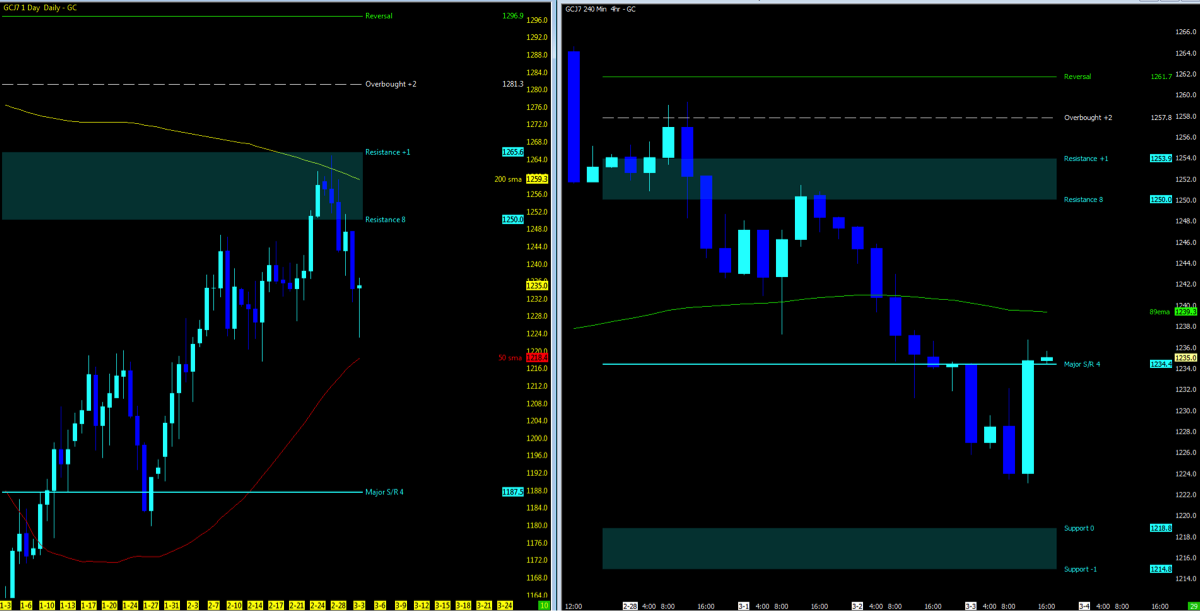
GC – GOLD Futures
Technical Momentum: DOWNTREND
CHARTS: Daily; 4hr
Thanks for reading and remember to always use a stop at/around key technical trend levels.
Twitter: @TradingFibz
The author trades futures intraday and may have a position in the mentioned securities at the time of publication. Any opinions expressed herein are solely those of the author, and do not in any way represent the views or opinions of any other person or entity.


