Broad Stock Market Overview for July 30, 2018
This week looks to be a pivotal one for the S&P 500 (INDEXCBOE:.INX) and Nasdaq (INDEXNASDAQ:.IXIC) Indices. After last week’s reversals on the Nasdaq and Russell 2000, the big indices need to hold firm as additional earnings come in and key price support levels get challenged.
Last week’s candlesticks point to bearish reversal action everywhere and right now, there seems to be a feeble attempt to hold support across the board. Confidence in upward motion has been shaken, most certainly. Watch your edges of support for bounces that fail. Volume profiles are still messy and crosscurrents are everywhere, so be prepared for anything – including buyers taking charge once more.
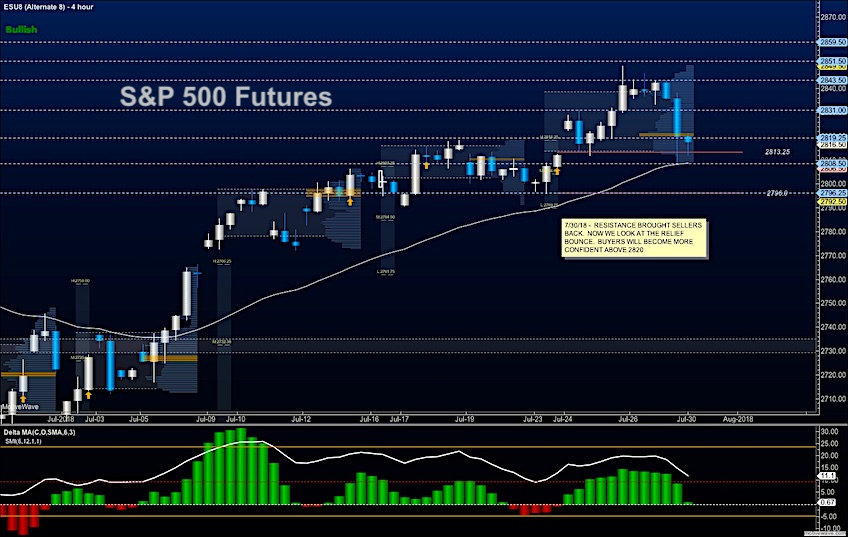
S&P 500 Futures
Buyers are on the hook to recover broken support. As summer rolls on here in the Northern Hemisphere, we are looking at buyers trying to hold the line above 2812 after a Friday that reversed much of the prior motion upward.
Patchy volume profiles certainly could strengthen up with a move lower into deeper support but this bullish market suggests that even if we do dip lower into the 2796 region once more, buyers will come to the rescue. The bullets below represent the likely shift of trading momentum at the successful or failed retests at the levels noted.
- Buying pressure intraday will likely strengthen with a bullish retest of 2822.5
- Selling pressure intraday will likely strengthen with a bearish retest of 2805.75
- Resistance sits near 2817.75 to 2828.25, with 2834.75 and 2846.75 above that.
- Support sits between 2812.75 and 2806.5, with 2798.25 and 2892.75
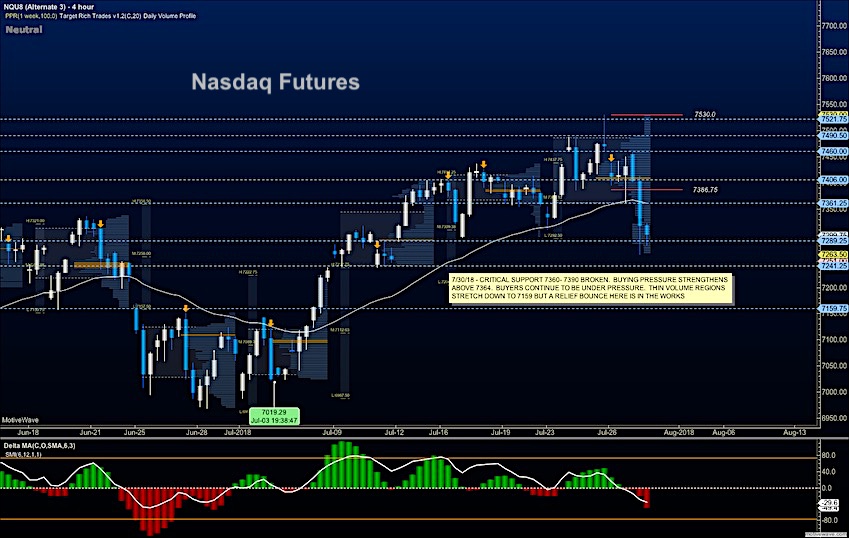
NASDAQ Futures
Traders have failed to hold a critical support region near 7330, making a way for sellers to continue to march us into deeper support. A relief bounce is potentially in play but sellers are waiting above in the current formation. The bullets below represent the likely shift of trading momentum at the successful or failed retests at the levels noted.
- Buying pressure intraday will likely strengthen with a bullish retest of 7332.75
- Selling pressure intraday will likely strengthen with a bearish retest of 7284.5
- Resistance sits near 7321.5 to 7354.5 with 7370.5 and 7389.25 above that.
- Support sits between 7296.5 and 7252.75, with 7240.5 and 7212.75 below that.
WTI Crude Oil
Buyers still hold price grinding in an upward channel- nine days in the formation. Momentum is neutral to bullish as support, though broken in prior times, recovers and lifts from 69.04. Pullbacks will be buying regions as traders sit positioned in the grinding move to recapture 70 and higher. The bullets below represent the likely shift of trading momentum at the successful or failed retests at the levels noted.
- Buying pressure intraday will likely strengthen with a bullish retest of 70.37
- Selling pressure intraday will strengthen with a bearish retest of 68.8
- Resistance sits near 70.14 to 70.34, with 70.56 and 71.27 above that.
- Support holds near 69.5 to 69.34, with 68.58 and 68.29 below that.
You can learn more about trading and our memberships HERE.
Twitter: @AnneMarieTrades
The author trades stock market futures every day and may have a position in mentioned securities at the time of publication. Any opinions expressed herein are solely those of the author, and do not in any way represent the views or opinions of any other person or entity.


