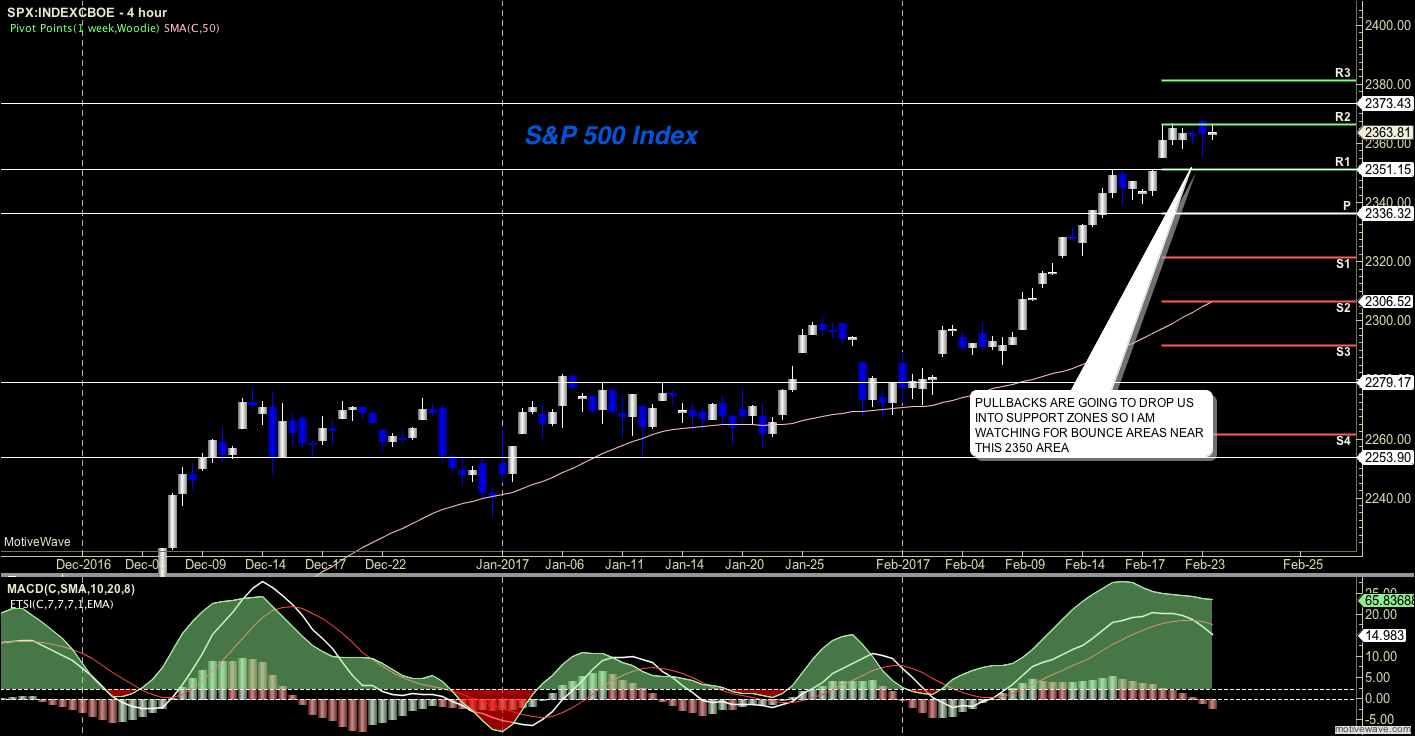
S&P 500 (INDEXSP:.INX,) Market Considerations For February 24, 2017
S&P 500 futures have dipped into important levels of support that are being tested at present. I’m looking for a bounce that potentially gives us lower highs. Bounces today might have a tough time holding.
Buying pressure will likely strengthen above a positive retest of 2363.75, while selling pressure will strengthen with a failed retest of 2349.75.
Price resistance sits near 2361.5 to 2366.75, with 2369.25 and 2372.5 above that. Price support holds between 2352.75 and 2350.25, with 2346.25 and 2342.5 below that
See today’s economic calendar with a rundown of releases.
TRADING SETUPS
S&P Futures – E-mini
Upside trades – Two options for entry
- Positive retest of continuation level -2361.75
- Positive retest of support level– 2354.25
- Opening targets ranges – 2351.5, 2355.5, 2357.25, 2360.75, 2362.75, 2365, 2369.25, 2372.25, 2375.75
Downside trades – Two options for entry
- Failed retest of resistance level – 2358.25
- Failed retest of support level – 2354.25
- Opening target ranges – 2356.75, 2354.5, 2351.5, 2346.25, 2343.25, 2337.5, 2334, 2329.25, 2323.5, 2319, 2315.25, 2313, 2309.75, 2304.75, 2302.75, 2299.5, 2297, 2294.25, 2291.75, 2288.5, 2284.5, 2279.75, 2276.25, 2274.25, 2272.25, 2269.5, 2264.5, 2260.5, 2256, 2253.5 and 2249.75
Nasdaq Futures
The NQ_F faded more deeply than it has for a time in a retest of support into 5305. At this point, it has drifted below, but the test of the region from underneath will tell the tale. Failure here takes us into levels deeper into 5287-5295. Bounces are very likely to give us lower highs.
- Buying pressure will likely strengthen with a positive retest of 5329.5
- Selling pressure will strengthen with a failed retest of 5290
- Resistance sits near 5330.25 to 5337, with 5354.75 and 5357.75 above that
- Support holds between 5305.25 and 5300.5, with 5290.75 and 5284.25 below that
Upside trades – Two options
- Positive retest of continuation level -5329.5
- Positive retest of support level– 5306.5
- Opening target ranges – 5313.5, 5320.25, 5328.75, 5335.25, 5340.25, 5346.75, 5350.5, 5354.5, 5360.25, 5364.5, 5367.75, 5382.75
Downside trades- Two options
- Failed retest of resistance level -5320.25
- Failed retest of support level– 5301.5
- Opening target ranges – 5315.75, 5306.5, 5297.75, 5294.25, 5291.25, 5286.75, 5277.75, 5273.75, 5271.25, 5266.75, 5263.25, 5259, 5252.75, 5246.75, 5240.25, 5235.25, 5229.75, 5227.75, 5221.75, 5217.75, 5212.5, 5207.5
Crude Oil –WTI
Bullish news did not keep oil from retreating to test the breakout levels. We are likely to test 53.88 and bounce, but could drift back into the congested regions. We are certainly choppy but grinding forward.
- Buying pressure will likely strengthen with a positive retest of 54.54
- Selling pressure will strengthen with a failed retest of 53.8
- Resistance sits near 54.88 to 55.15, with 55.6 and 56.05 above that.
- Support holds between 53.8 and 53.55, with 53.09 and 52.68 below that.
Upside trades – Two options
- Positive retest of continuation level – 54.54
- Positive retest of support level – 54.2
- Opening target ranges – 53.35, 54.54, 53.68, 53.88, 54.05, 54.19, 54.54, 54.85, 55.04, 55.12, 55.48, 55.68, 55.88, 56.04
Downside trades- Two options
- Failed retest of resistance level – 54.2
- Failed retest of support level – 53.8
- Opening target ranges – 54.01, 53.88, 53.56, 53.31, 53.09, 52.85, 52.64, 52.37, 52.2, 52.06, 51.91, 51.72, 51.52, 51.22, 51.04, 50.82, 50.47, 50.3, and 50.16
If you’re interested in watching these trades go live, join us in the live trading room from 9am to 11:30am each trading day.
Visit TheTradingBook for more information.
If you’re interested in the live trading room, it is now primarily stock market futures content, though we do track heavily traded stocks and their likely daily trajectories as well – we begin at 9am with a morning report and likely chart movements along with trade setups for the day.
As long as the trader keeps himself aware of support and resistance levels, risk can be very adequately managed to play in either direction as bottom picking remains a behavior pattern that is developing with value buyers and speculative traders.
Twitter: @AnneMarieTrades
The author trades stock market futures every day and may have a position in mentioned securities at the time of publication. Any opinions expressed herein are solely those of the author, and do not in any way represent the views or opinions of any other person or entity.


