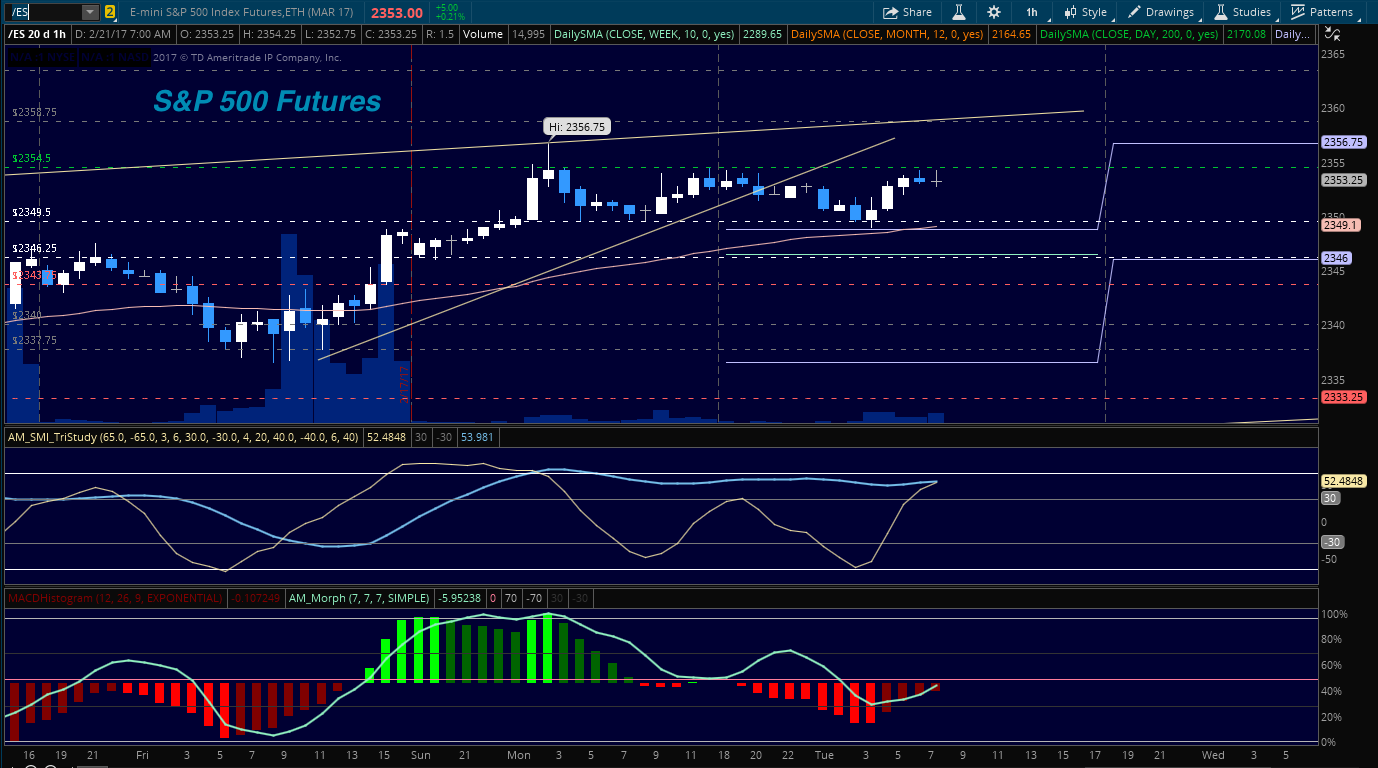
S&P 500 Futures Market Considerations For February 21, 2017
ES_F– Bullish action still holds with higher support levels building today. We have been trapped in a channel after reaching a new high in the Globex event (holiday yesterday). Pullbacks on the S&P 500 (INDEXSP:.INX) will still be bought. Although the chart is not exhibiting much that suggests a collapse, we should be on the lookout for some pullbacks in the near term. Be particularly careful with breakouts today.
Buying pressure will likely strengthen above a positive retest of 2354.5, while selling pressure will strengthen with a failed retest of 2343.75.
Price resistance sits near 2354.5 to 2356.75, with 2358.25 and 2363.5 above that. Price support holds between 2343.75 and 2340, with 2337.75 and 2333.25 below that
See today’s economic calendar with a rundown of releases.
Trading Setups For February 21, 2017
E-mini S&P Futures
S&P 500 Futures Trading
Upside trades – Two options for entry
- Positive retest of continuation level -2354.5 ( be careful here)
- Positive retest of support level– 2349.5
- Opening targets ranges – 2351, 2354.5, 2356, 2358.75, 2363.50, and 2367
Downside trades – Two options for entry
- Failed retest of resistance level -2351.5
- Failed retest of support level– 2346.25
- Opening target ranges – 2349.5, 2346.25, 2343.25, 2337.5, 2334, 2329.25, 2323.5, 2319, 2315.25, 2313, 2309.75, 2304.75, 2302.75, 2299.5, 2297, 2294.25, 2291.75, 2288.5, 2284.5, 2279.75, 2276.25, 2274.25, 2272.25, 2269.5, 2264.5, 2260.5, 2256, 2253.5 and 2249.75
Nasdaq Futures
The NQ_F presented a new high yesterday during the holiday and still holds a bullish trend -however, momentum continues to drift down a bit more. Pullbacks on the Nasdaq (INDEXNASDAQ:.IXIC) will continue to be bought and trends across time frames are still bullish in general.
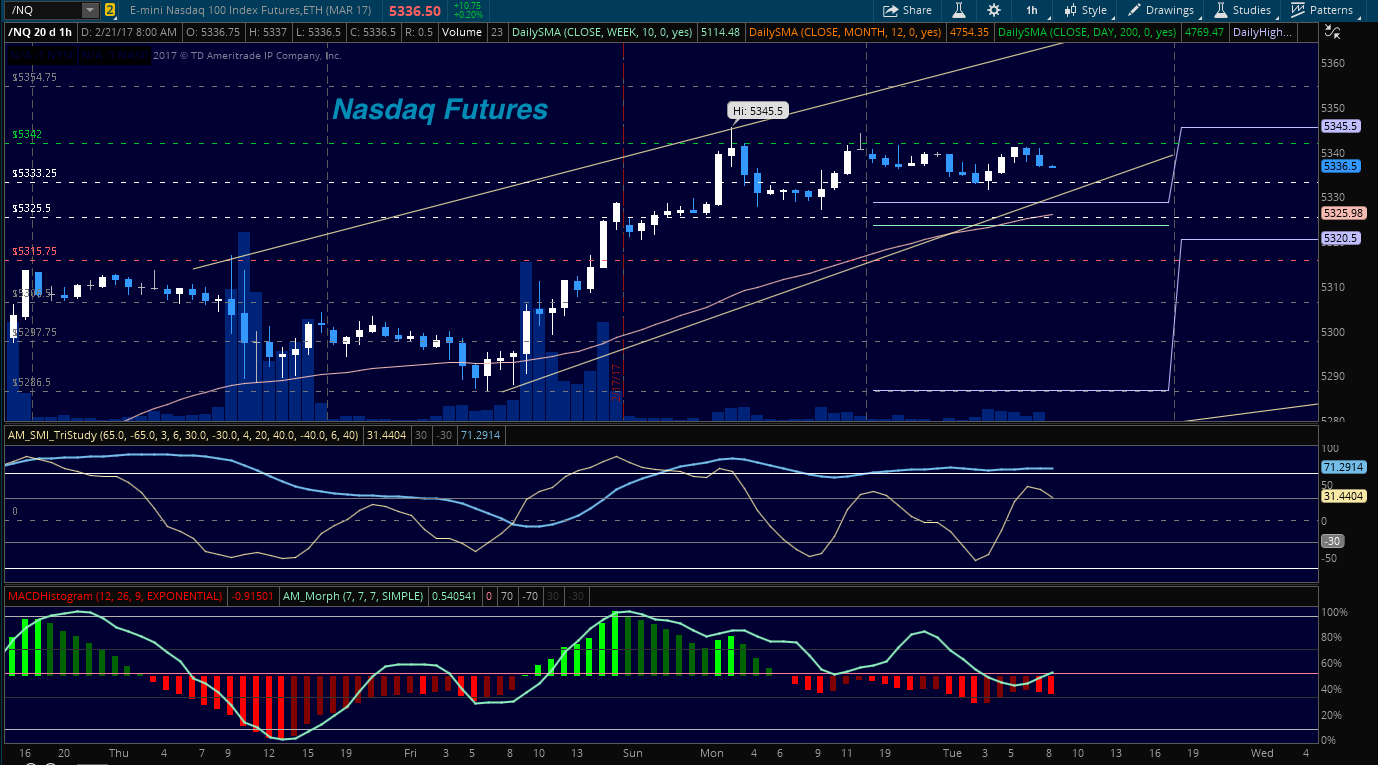
- Buying pressure will likely strengthen with a positive retest of 5342
- Selling pressure will strengthen with a failed retest of 5315.75
- Resistance sits near 5345.25 to 5350, with 5354.75 and 5369.25 above that
- Support holds between 5315.75 and 5297.75, with 5286.75 and 5271.25 below that
Upside trades – Two options
- Positive retest of continuation level -5342.5 ( careful with buying continuation)
- Positive retest of support level– 5325.5
- Opening target ranges – 5333.25, 5340.75, 5345, 5354.5, 5360.25, and 5369.25
Downside trades- Two options
- Failed retest of resistance level -5333.25
- Failed retest of support level– 5325.5
- Opening target ranges – 5325.5, 5315.75, 5306.5, 5297.75, 5294.25, 5291.25, 5286.75, 5277.75, 5273.75, 5271.25, 5266.75, 5263.25, 5259, 5252.75, 5246.75, 5240.25, 5235.25, 5229.75, 5227.75, 5221.75, 5217.75, 5212.5, 5207.5
Crude Oil –WTI
News that hedge funds continue to increase their long positions with a 90% compliance from OPEC has moved the WTI contract out of the congestion to the upper formations in the chart. Targets near 60 are now being assessed by many analysts, with the idea that the US will not lift the shortfall with continued output of shale filling the gap. Reports will be released one day later than normal with Wednesday giving us the API, and Thursday giving us the EIA.
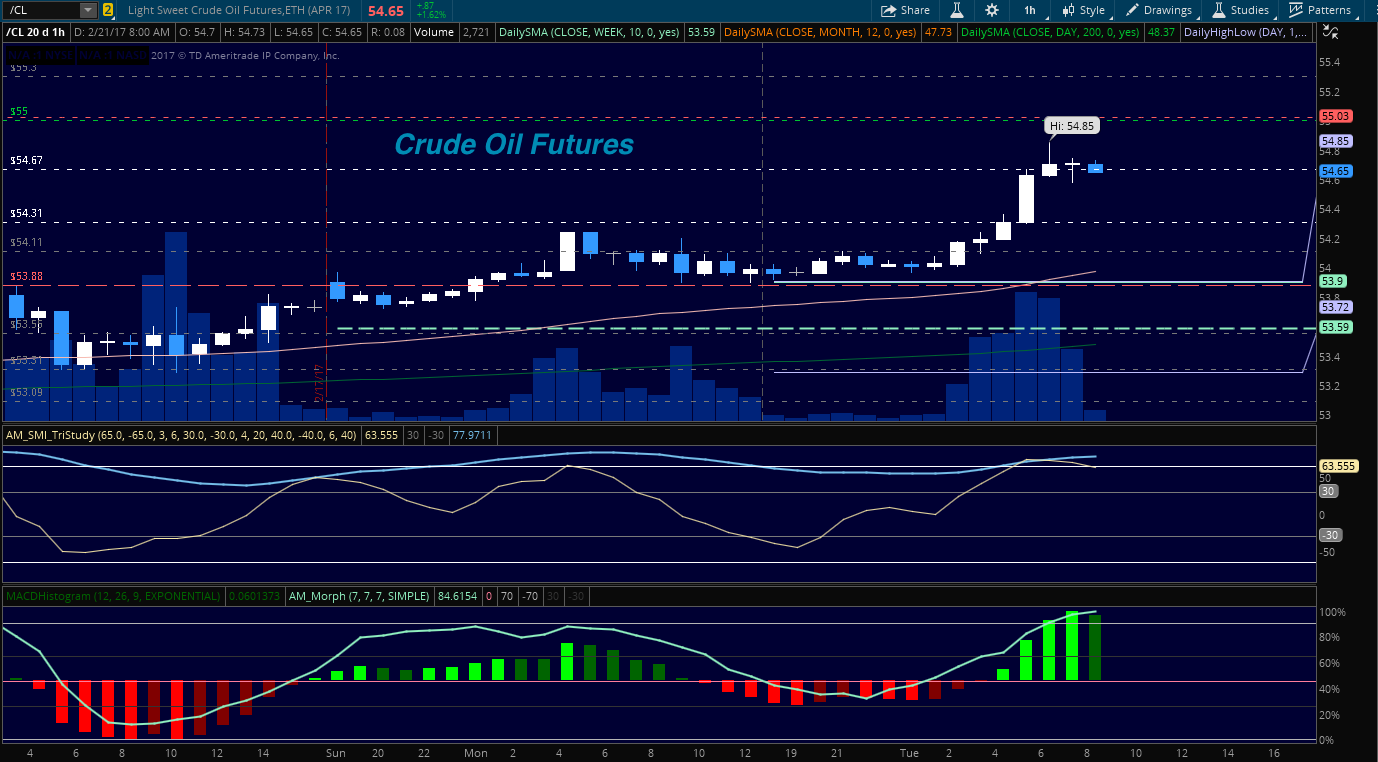
- Buying pressure will likely strengthen with a positive retest of 54.85
- Selling pressure will strengthen with a failed retest of 53.88
- Resistance sits near 54.85 to 55.15, with 55.6 and 56.05 above that.
- Support holds between 53.88 and 53.55, with 53.09 and 52.68 below that.
Upside trades – Two options
- Positive retest of continuation level -54.85
- Positive retest of support level– 54.31
- Opening target ranges – 53.35, 53.68, 53.88, 54.05, 54.19, 54.31, 54.51, 54.85, 55.02, 55.19, 55.35, 55.68
Downside trades- Two options
- Failed retest of resistance level -54.3
- Failed retest of support level– 53.88
- Opening target ranges – 54.11, 53.88, 53.56, 53.31, 53.09, 52.85, 52.64, 52.37, 52.2, 52.06, 51.91, 51.72, 51.52, 51.22, 51.04, 50.82, 50.47, 50.3, and 50.16
If you’re interested in watching these trades go live, join us in the live trading room from 9am to 11:30am each trading day.
Visit TheTradingBook for more information.
If you’re interested in the live trading room, it is now primarily stock market futures content, though we do track heavily traded stocks and their likely daily trajectories as well – we begin at 9am with a morning report and likely chart movements along with trade setups for the day.
As long as the trader keeps himself aware of support and resistance levels, risk can be very adequately managed to play in either direction as bottom picking remains a behavior pattern that is developing with value buyers and speculative traders.
Twitter: @AnneMarieTrades
The author trades stock market futures every day and may have a position in mentioned securities at the time of publication. Any opinions expressed herein are solely those of the author, and do not in any way represent the views or opinions of any other person or entity.


