March 30 stock market futures are rallying as Janet Yellen’s comments yesterday gave the markets the nudge it needed to accelerate into big target levels above.
On S&P 500 futures, Fibonacci extended targets are 2057.75, 2061.5, and 2067.75. With this big move, however, price action is a bit extended. Support has been lifted into 2047.5 and 2050.5, but buyers seem ready to defend the 2056-2054 levels.
Momentum on the four hour chart is bullish-buyers remain in control, but tighter time frames suggest a pullback into higher support across stock market futures.
Shorter time frame momentum indicators are bullish and very extended – a test of support areas are on the horizon. Downside motion should be limited, however.
See today’s economic calendar with a rundown of releases.
THE RANGE OF THURSDAY’S MOTION
Crude Oil Futures (CL_F)
Watch for the EIA report at 10:30am. Bounce action continues from a support test near 37.96. Support action is likely to be tested near the 37.68 region, and buyers should actively try to defend this area, if the chart gets this low – of course, the EIA report could surprise but as builds get smaller, we know that eventually, we will move to a draw situation before more rigs come online again.
Today, the trading ranges on crude oil futures are between 37.59 and 40.1. Breaks of these levels are likely retrace as the lower number is strong support for now, and the overall trend is still bullish on the daily time frame.
Moving averages in oil still show tight coiling, and slightly negative momentum on longer intraday time frames that continues to lift. Resistance is now lower between 40.24 and 39.65; deeper support is likely near 37.59 and 37.36.
Intraday long trading setups on crude oil suggest a long off a 39.08 positive retest (check momentum here), or 38.45 positive retest bounce into targets of 38.94, 39.15, 39.46, 39.74, 40.1, 40.3, 40.47, 40.74, 41.28, and if buyers hold on, we’ll see 41.74 to potentially 42.1, and 42.46.
Intraday short trading setups suggest a short below a 38.42 failed retest with negative divergence, or the failed retest of 39.48 sends us back through targets at 39.15, 38.94, 38.40, 38.09, 37.7, and 37.36, if sellers hang on.
E-mini S&P 500 Futures (ES_F)
Below is a S&P 500 futures chart with price support and resistance trading levels for today. Click to enlarge.
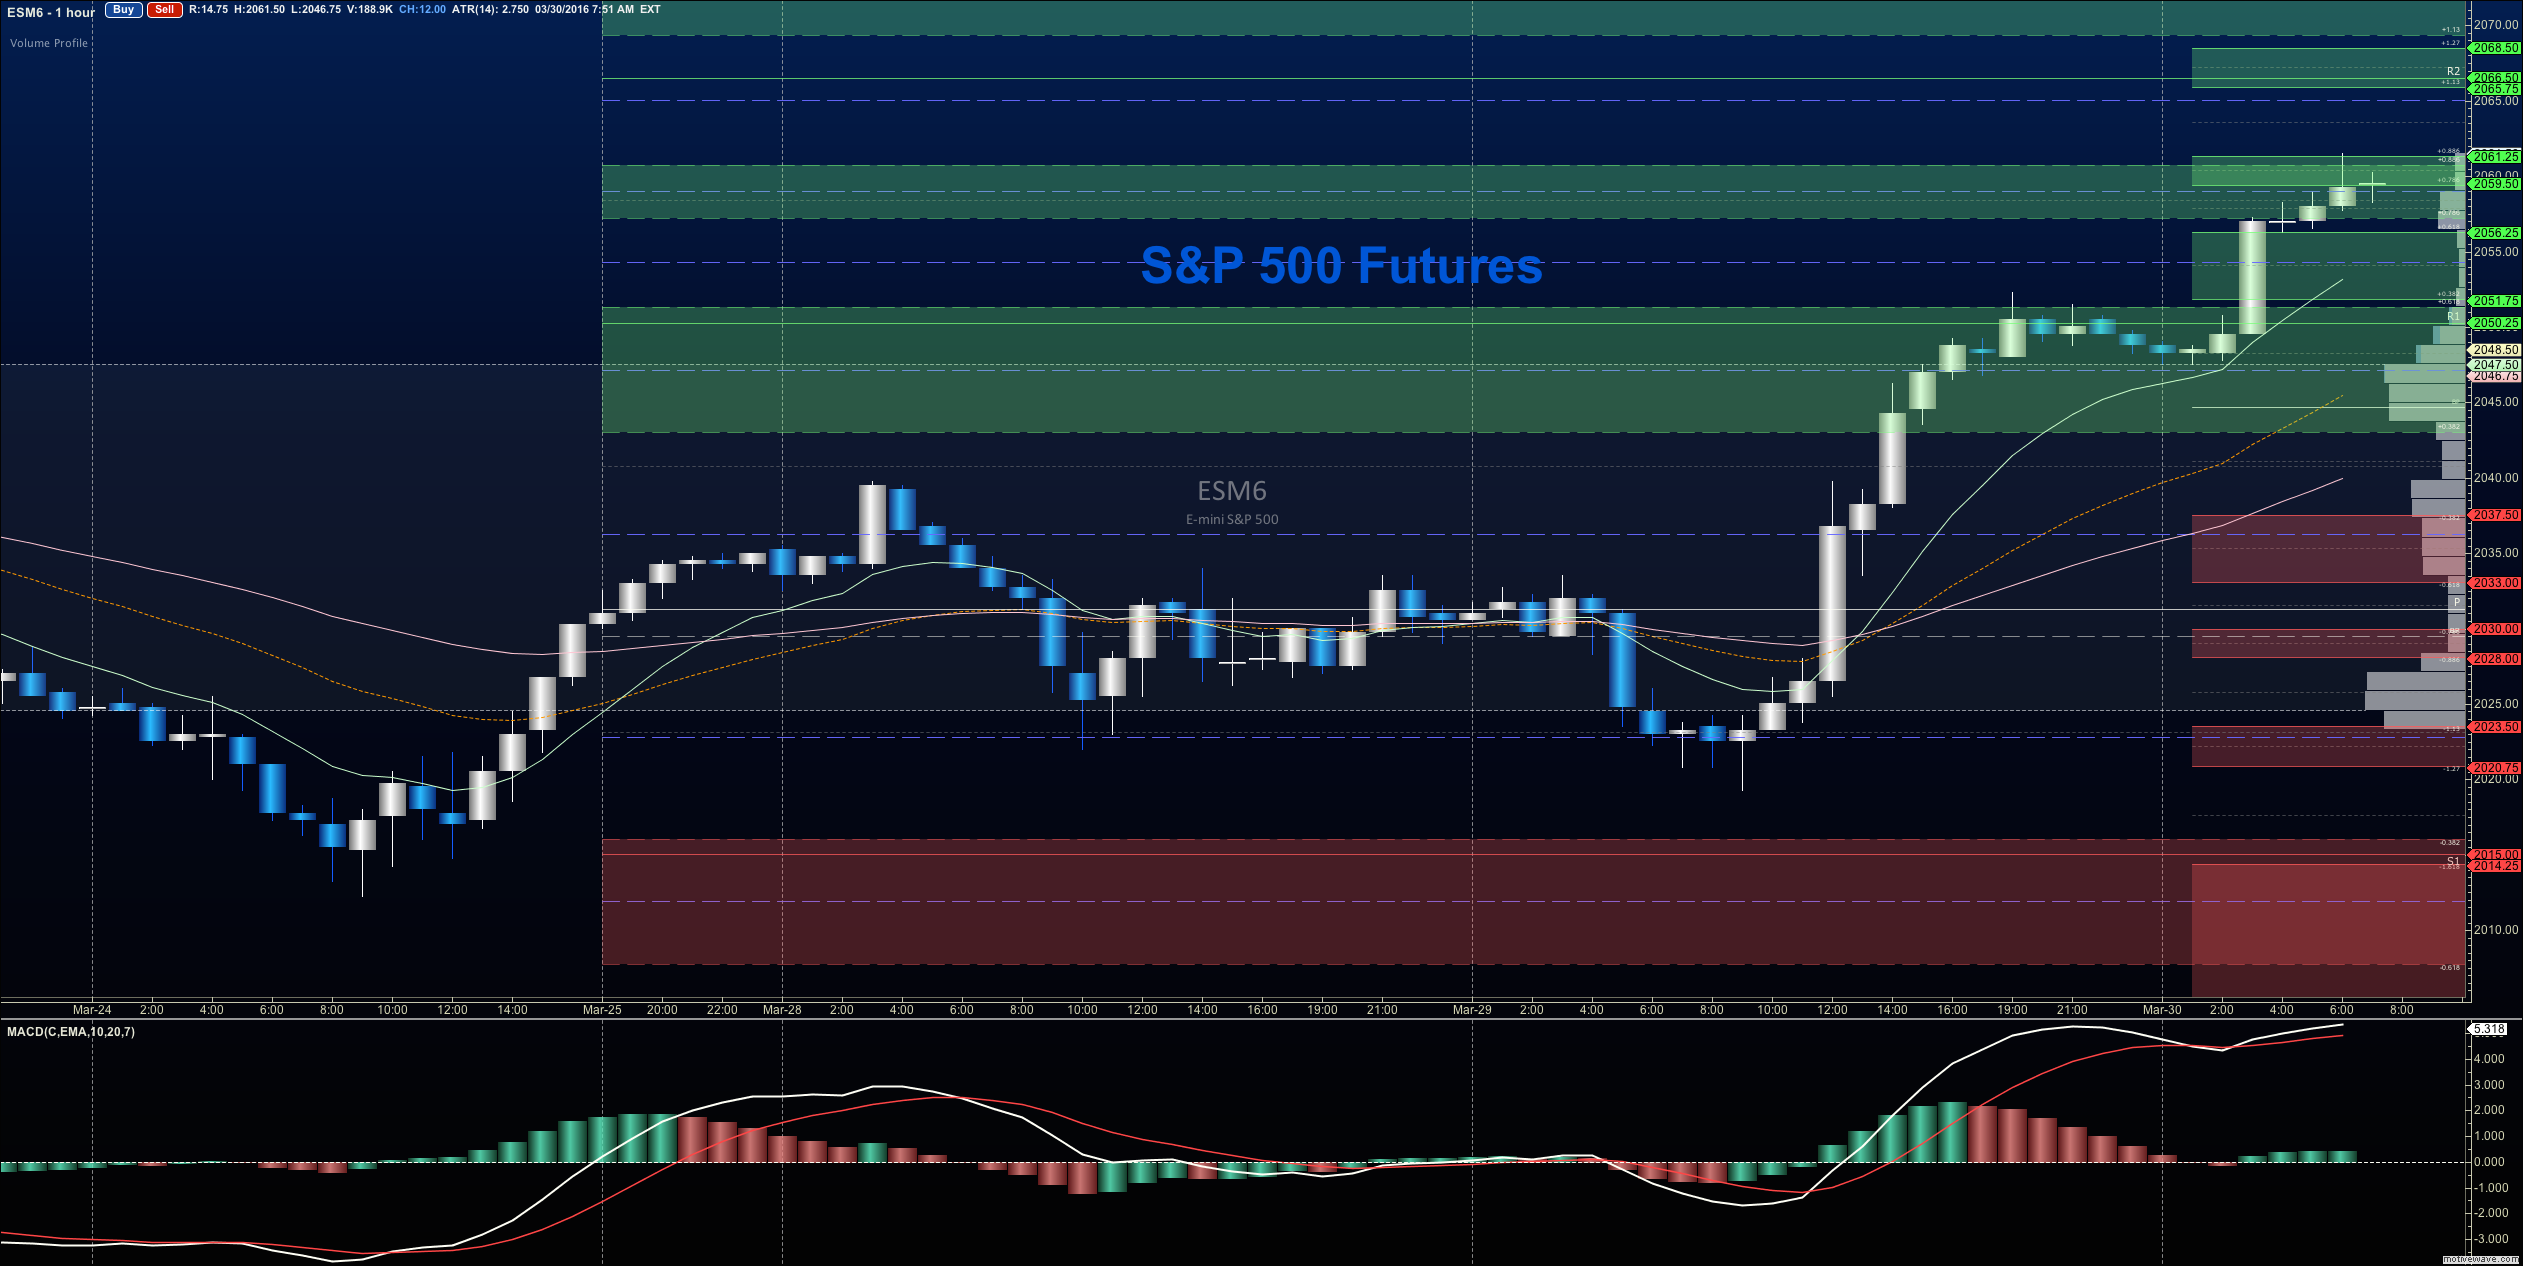
As mentioned, March 30 stock market futures are in rally mode. Buying action has been strong into higher target levels without any real retrace. The S&P 500 futures levels between 2061.5- 2067.75 serve as front line resistance, with 2047.5- 2050.5 now as support. Stretches north could see 2069.5 (but that should create a selling opportunity short term), and deep support could be near 2040 at this point. For now, buyers are re-establishing power. The main space the chart needs to hold is 2033 – and drifts down there will bring buyers back to defend the area.
Upside motion on S&P 500 futures has the best setup on the positive retest of 2054.75 or a bounce off 2051.25 with positive momentum. I use the 30min to 1hr chart for the breach and retest mechanic. Targets from 2051.75 are 2054.5, 2057.5, 2059.5, 2061.5, 2064.5, 2067.75, and if we can catch a bid there, we could expand into 2071.5, 2074.25, and 2077.5. Longs are still trending over the bigger picture for now, but momentum lackluster, it should be a sideways to upward grind to the higher targets.
Downside motion opens below the failed retest of 2056.5 or at the failed retest of 2066.5 with negative divergence. Retracement into lower levels from 2056 gives us the targets 2054.25, 2051.75, 2047.75, 2044.5, 2041.25, 2039.75, 2035.75, 2031.25, and perhaps 2027.5 if selling really takes hold (clearly possible if buyers lose their footing, or lower highs continue to develop).
If you’re interested in the live trading room, it is now primarily stock market futures content, though we do track heavily traded stocks and their likely daily trajectories as well – we begin at 9am with a morning report and likely chart movements along with trade setups for the day.
As long as traders remain aware of support and resistance levels, risk can be very adequately managed to play in either direction as bottom picking remains a behavior pattern that is developing with value buyers and speculative traders.
Thanks for reading.
Twitter: @AnneMarieTrades
The author trades stock market futures every day and may have a position in mentioned securities at the time of publication. Any opinions expressed herein are solely those of the author, and do not in any way represent the views or opinions of any other person or entity.

: Worrisome to Broader Market?")


