March 11 stock market futures are rallying back aggressively after a steep pullback yesterday. We currently sit in the same place as we did before the ECB release yesterday.
On S&P 500 futures, there is a congested space between 1991.5 and 1997 this morning, with 1994.5 as an area of consideration to watch. Momentum remains damp. Buyers will force price to hold at support regions once more.
Momentum on the four hour chart is neutral, and suggests that level to level trading will be valid today. Daily charts continue to show momentum as trending positive, and still in positive territory for stock market futures. A clear signal to me that the power of momentum still sits with buyers as we sit near the top of the trading range. The key will be watching for technical divergence.
Shorter time frame momentum indicators are sloping up, but jammed against resistance. 1991.25 – 1997 is the support region to watch for sellers to test and for buyers to hold if this chart fails to move forward. This setup mirrors yesterday.
See today’s economic calendar with a rundown of releases.
THE RANGE OF THURSDAY’S MOTION
Crude Oil Futures (CL_F)
The outlook for crude oil futures for March 11 is choppy but levels much be respected. After a retrace of price action for three days, crude oil has drifted above strong resistance. The buyers will have to hold the retest of 38.4 for the chart to advance to the regions above near 38.94 into 40.
Today, the trading ranges for crude oil are between 37.6 and 38.98 –I expect the possibility for breaches on either side here is most likely. The charts have been very choppy as the battle for control continues. So be careful at those edges again today.
Moving averages in oil show rising positive momentum on longer time frames, and resistance has been broken. Intraday support is steady at 37.03, but a failed retest there could significantly change the structure of this chart. Lots of contention, and hence congestion, exists at 37.7.
Intraday long trade setup suggests a long off 38.42 positive retest, or 37.92 positive retest into 38.2, 38.42, 38.57, 38.7 and if buyers hold on, we’ll see 38.94 to potentially 39.6.
Intraday short trade setup suggests a short below a 38.3 failed retest with negative divergence, or the failed retest of 38.7 sends us back through targets at 38.52, 38.28, 37.94, 37.7, 37.12 and back into familiar regions seen near 36.24, if sellers hang on.
Have a look at the Fibonacci levels marked in the blog for more targets.
E-mini S&P 500 Futures (ES_F)
Below is a S&P 500 futures chart with price support and resistance trading levels for today. Click to enlarge.
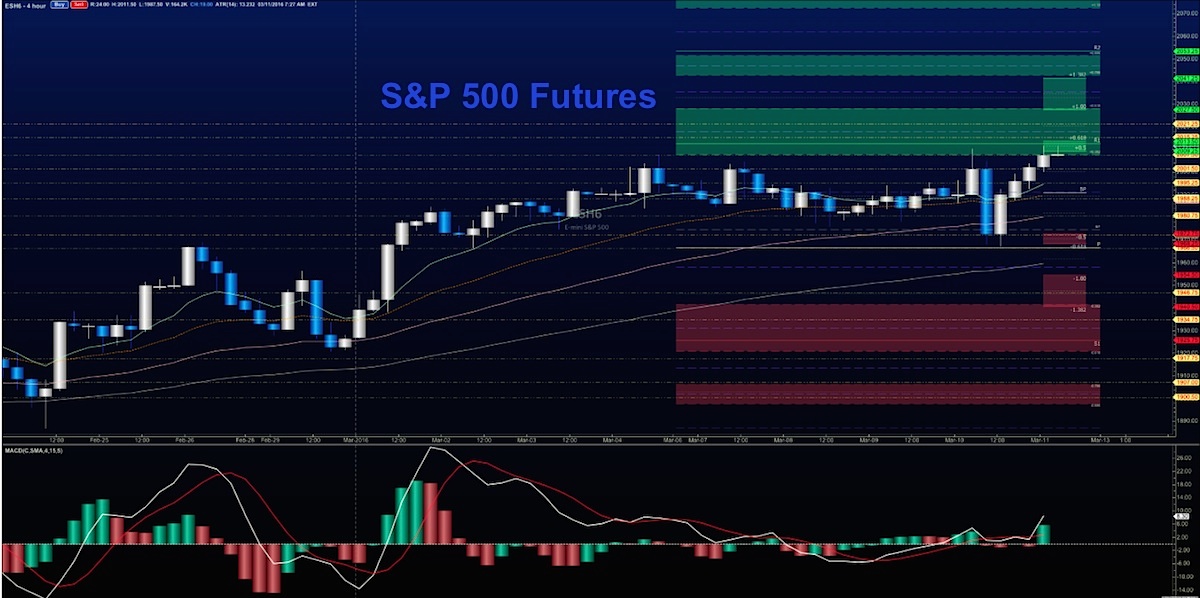
The outlook for March 11 stock market futures depends largely on the retest of resistance today. Buyers are testing resistance again near 1999-2001.75. Overhead supply remains strong, but momentum is mixed and flattening – it won’t be easy for buyers to breach resistance.
Upside motion has the best setup on S&P 500 futures the retest of 1997.75 or a bounce off 1990.5 with positive momentum. I use the 30min to 1hr chart for the breach and retest mechanic. Targets from 1994.5 are 1997.25, 1999, 2000.25, 2003.25, 2007.5, and if we can catch a bid there, we could expand back into 2011.25 and beyond. The next big resistance test sits at the region between 2011-2015, then 2021-2025. Watch the higher lows to keep you on the right side of the long trade. Charts are firming up, but expect pullbacks to find buyers – see the fib zones for support regions.
Downside motion opens below the failed retest of 1990.5 or at the failed retest of 2005 with negative divergence – but really watch for the higher lows there- the higher lows will signal that your short is ill positioned. Retracement into lower levels from 2003.5 gives us the targets 1999.25, 1994.25, 1991.5, 1987.75, 1984.5, 1981.5, 1974.75, 1971.25, 1969.25 and perhaps 1964.5 if selling really takes hold.
Have a look at the Fibonacci levels marked in the blog for more targets.
If you’re interested in the live trading room, it is now primarily stock market futures content, though we do track heavily traded stocks and their likely daily trajectories as well – we begin at 9am with a morning report and likely chart movements along with trade setups for the day.
As long as traders remain aware of support and resistance levels, risk can be very adequately managed to play in either direction as bottom picking remains a behavior pattern that is developing with value buyers and speculative traders.
Thanks for reading.
Twitter: @AnneMarieTrades
The author trades stock market futures every day and may have a position in mentioned securities at the time of publication. Any opinions expressed herein are solely those of the author, and do not in any way represent the views or opinions of any other person or entity.


")
