Stock market futures moved higher overnight before moving back to even during the morning of March 28. But the charts are still highlighting some key setups.
The anticipated bounce at the end of last week delivered and “long” price action continued all day and into the Sunday night stock market futures session. We are now on the way to test support of the current move – looks like that number is 2029-2031.5; that’s support today. Resistance sits above 2038.5-2040.75. Momentum in the short term has shifted bearish since 10am eastern yesterday. Deep support is still likely to be defended near 2009-2011. Sellers will now defend 2032-2037.5 as near-term resistance.
The Morning Report: Bulls and Bears Battling
Momentum on the four hour chart is neutral – sideways trading ahead –slope of trend on longer time frames suggests buyers will still show up at key support levels. Continue to watch for lower highs to continue, if sellers hold momentum and fail price bounce off resistance. The failed retest of the 2024 area will signal more bearish momentum.
Shorter time frame momentum indicators are bullish but flattening, suggesting a pullback into support -but buyers still fighting to hold levels, so downside motion should stall at support zones.
See today’s economic calendar with a rundown of releases.
THE RANGE OF THURSDAY’S MOTION
Crude Oil Futures (CL_F)
Crude oil has been trading in a very tight trading range and that’s what traders will be watching today. The level for buyers to recapture is 40 for bullish action to continue – it does seem buyers are trying to recapture this level. We filled the gap between contracts and bounced after drifting lower. Buyers will become less aggressive if we fail the bounce to recapture 40.49 today.
Today, the trading ranges for crude oil are between 38.3 and 40.49. Breaks of these levels are likely retrace before moving again in the direction of the initial break as momentum remains neutral on four hour time frames.
Moving averages in oil show tight coiling, and slightly dampening momentum on longer time frames. Resistance is now lower between 40.89 and 41.48; deeper support is likely near 37.94 and 38.4.
Intraday long trading setups for crude oil futures suggest a long off a breach of 39.55 positive retest (check momentum here), or 40.25 positive retest bounce into targets of 40.47, 40.74, 41.28, 41.48, 41.74, and if buyers hold on, we’ll see 42.12 to potentially 42.46.
Intraday short trading setups suggest a short below a 39.4 failed retest with negative divergence, or the failed retest of 40.2 sends us back through targets at 39.84, 39.61, 39.15, 38.94, 38.48, 37.96, and 37.78, if sellers hang on.
Have a look at the Fibonacci levels marked in the blog for more targets.
E-mini S&P 500 Futures (ES_F)
Below is a S&P 500 futures chart with price support and resistance trading levels for today. Click to enlarge.
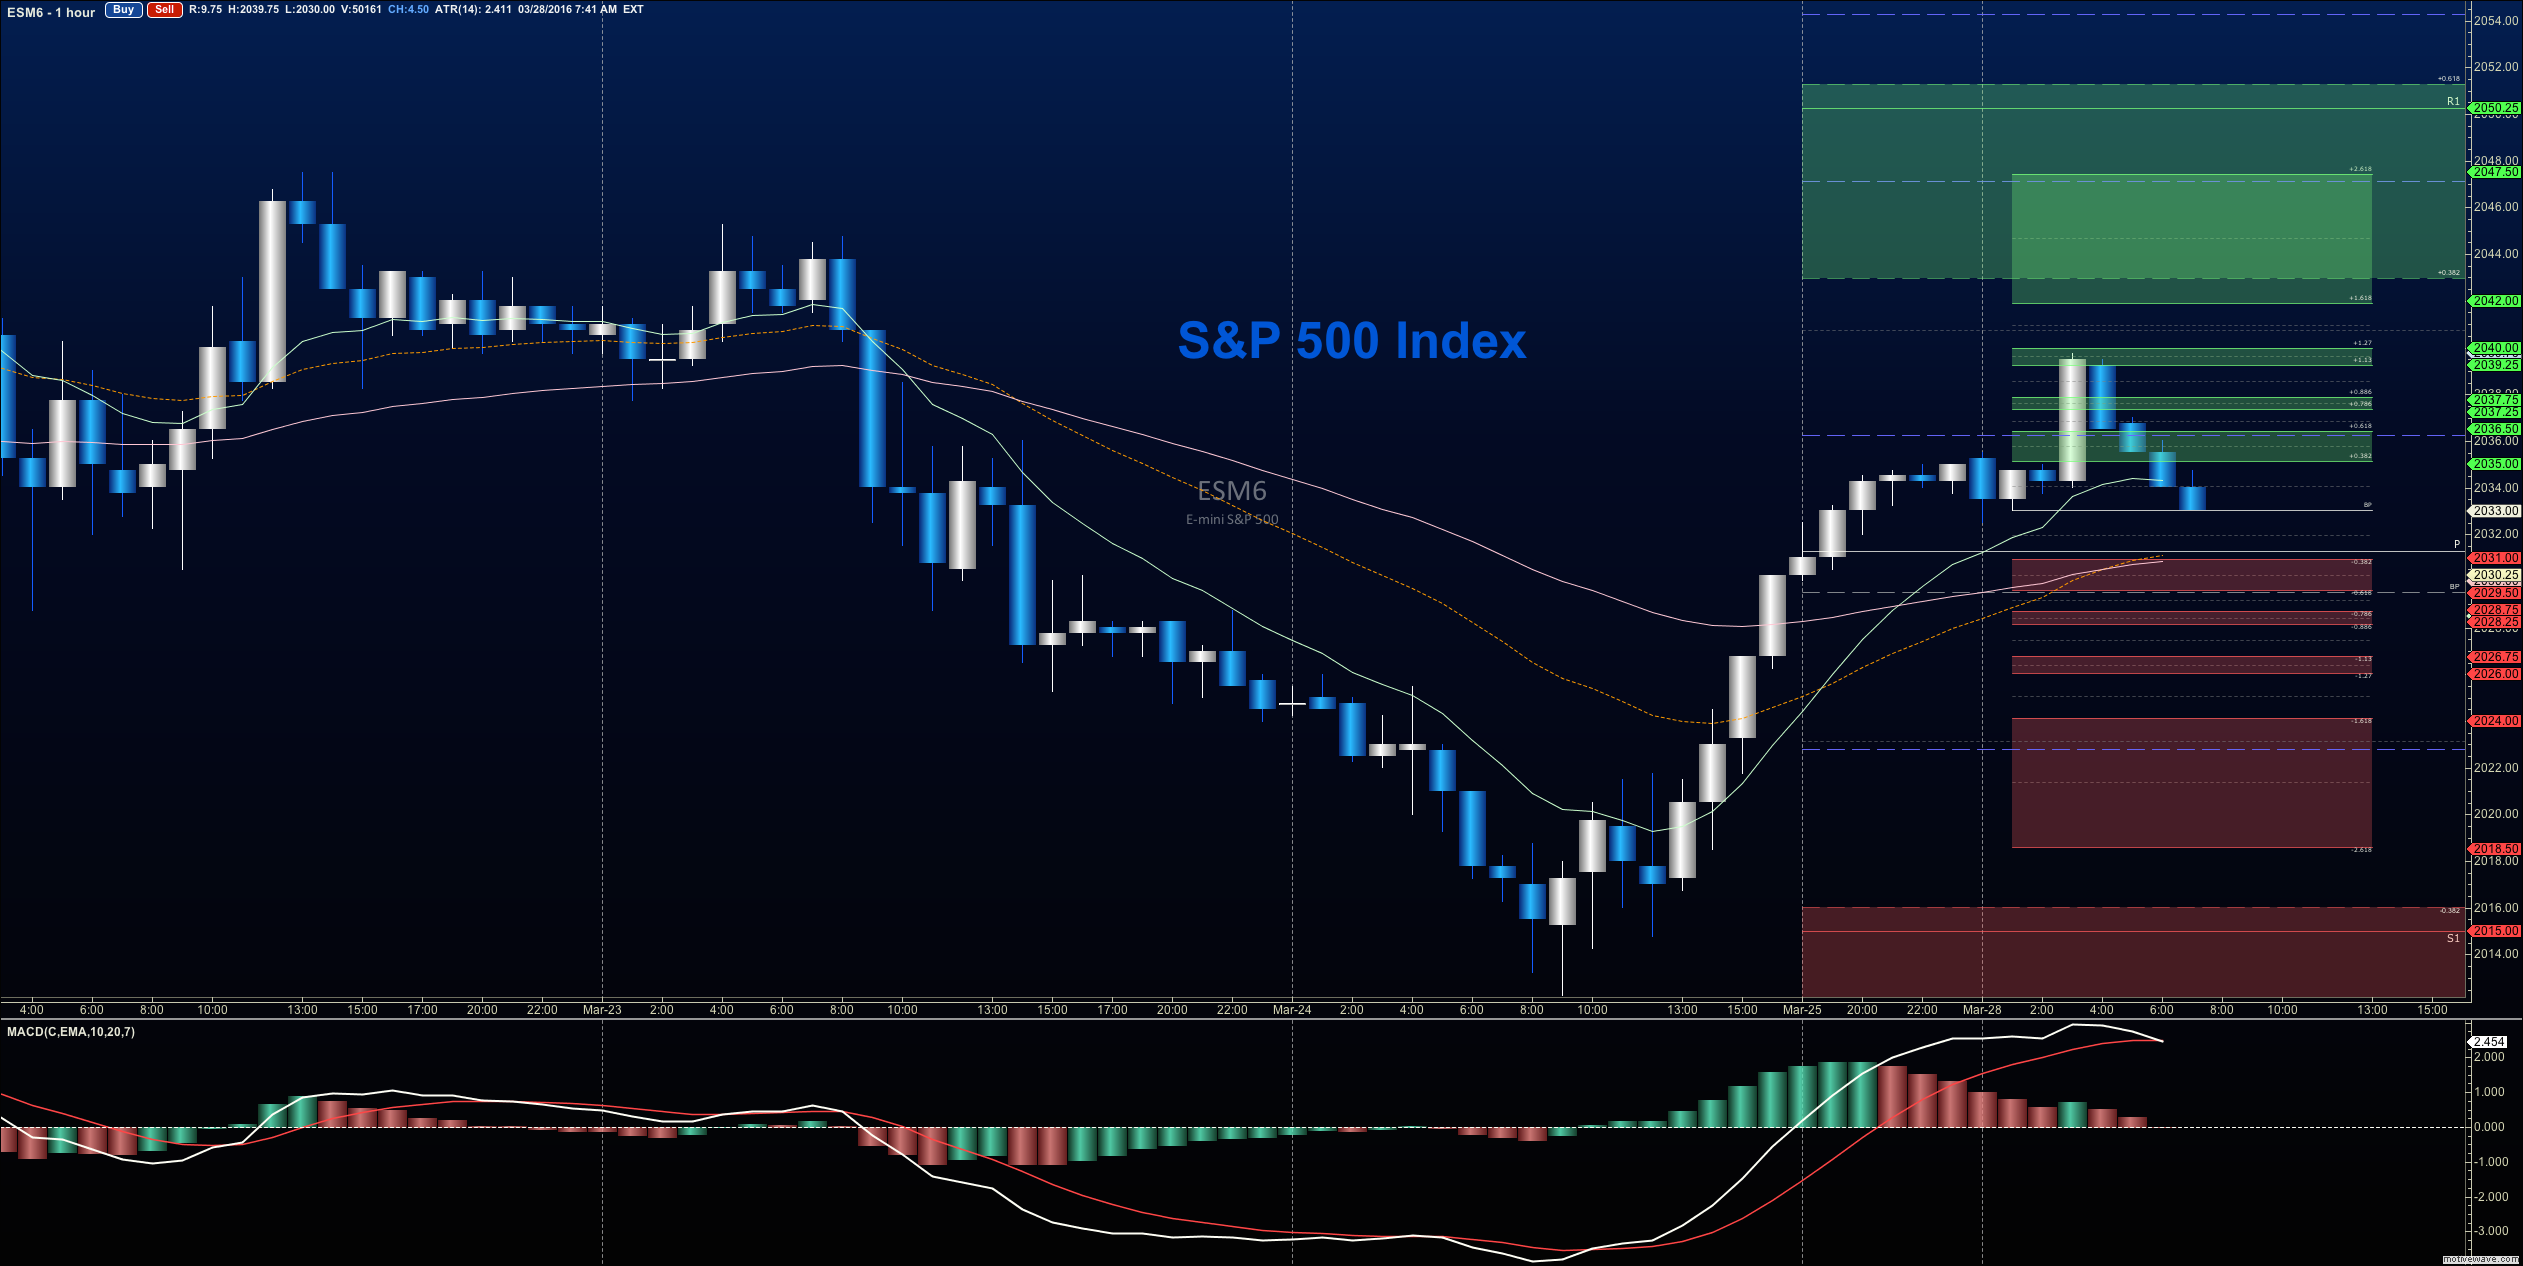
Buyers and sellers battle in contested regions near 2033 on S&P 500 futures again for four out of the last six trading days. The levels between 2039.5-2041 serve as front line resistance, with 2024-2029 now as support. Stretches north could see 2044.5, and deep support could be as far south at 2009 at this point. I suspect we have a greater chance of continued downside movement into support as the charts continue to look heavy, but buyers have been persistent, particularly near 2016-2019. I’ll be watching for the lower high potentially setting up today to signal the continued move into deeper support below near 2001-1997.
Upside motion has the best setup on the positive retest of 2033.75 or a bounce off 2024.75 with positive momentum (careful here). I use the 30min to 1hr chart for the breach and retest mechanic. Targets from 2024.75 are 2027.5, 2029.5, 2031.5, 2034.5, 2037.5, and if we can catch a bid there, we could expand into 2041.75 and 2047.5. A hold there could bring the buyers back in force.
Longs are still trending over the bigger picture for now, but we are still in a short-term cycle of negative price action across stock market futures.
Downside motion opens below the failed retest of 2033 or at the failed retest of 2029.5 with negative divergence. Retracement into lower levels from 2029.5 gives us the targets 2024.5, 2021.75, 2018.75, 2016.5, 2014.25, 2012.75, 2009.75, 2007.25, 2005.5, 2001.75, and perhaps 1997.5 if selling really takes hold (clearly possible if buyers lose their footing, or lower highs continue to develop).
If you’re interested in the live trading room, it is now primarily stock market futures content, though we do track heavily traded stocks and their likely daily trajectories as well – we begin at 9am with a morning report and likely chart movements along with trade setups for the day.
As long as traders remain aware of support and resistance levels, risk can be very adequately managed to play in either direction as bottom picking remains a behavior pattern that is developing with value buyers and speculative traders.
Thanks for reading.
Twitter: @AnneMarieTrades
The author trades stock market futures every day and may have a position in mentioned securities at the time of publication. Any opinions expressed herein are solely those of the author, and do not in any way represent the views or opinions of any other person or entity.


