Broad Stock Market Outlook for March 16, 2018
The S&P 500 did test support and fail briefly, traders did manage to keep us above most of the critical support levels noted yesterday.
Many of our charts are showing bullish triggers intraday to consider longs – but those are only valid off of key support zones – and only to hold into visible resistance. Buyers still have a lot to prove. Be cautious in both directions – minor advantage goes to buyers today – but again, NOT at breakout areas, but instead off of support levels.
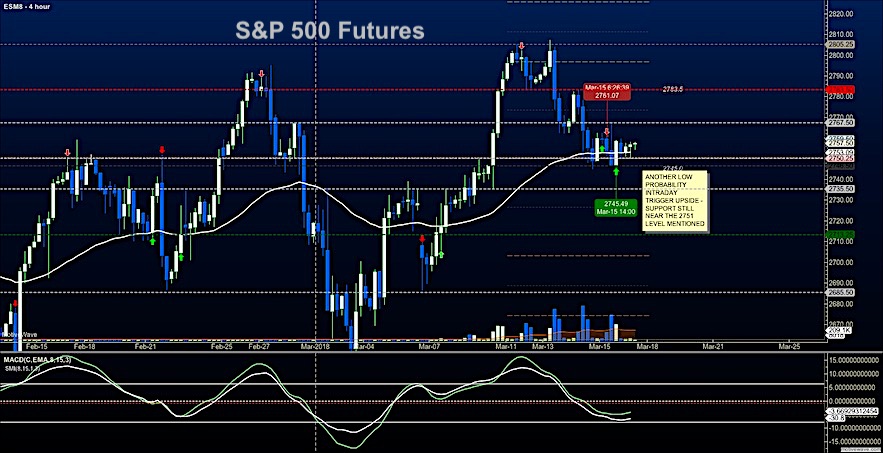
S&P 500 Futures
Support watch still near 2750 – but lower highs are still presenting as we try to create a rounded bottom intraday. We still need to breach and hold 2762 before buyers gather any traction – yesterday we broke 2762 but we could not hold it. We will watch this region again for signals that our long trades can continue. As momentum flattens, assume range based trading until we break and hold through the edges- either above or below. The bullets below represent the likely shift of trading momentum at the positive or failed retests at the levels noted.
- Buying pressure intraday will likely strengthen with a bullish retest of 2761.5
- Selling pressure intraday will likely strengthen with a bearish retest of 2750
- Resistance sits near 2760.5 to 2767.5, with 2779.75 and 2802.75 above that.
- Support sits between 2750.5 and 2745.75, with 2735.5 and 2729.50.
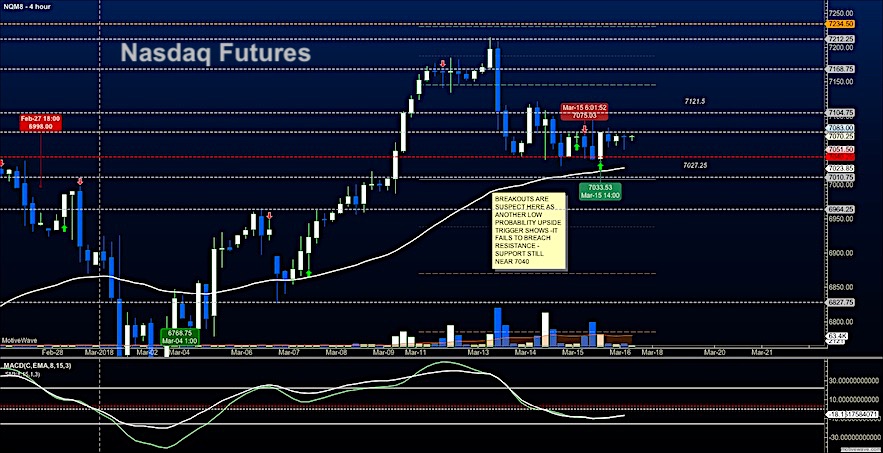
NASDAQ Futures
Congestion price action and repeated tests of support make for tough trades in either direction. The buyers hold a minor advantage this morning, but not at breakout areas – at support near 7050. Failed retests of 7040 or the retested breakout above 7077 will prove out trades that will give us range. We broke both these edges yesterday but both retests did not give us direction. A failed retest below 7040 will likely give us a press into levels below 7010 – and a hold above 7077 will send us back to 7146 potentially. The bullets below represent the likely shift of intraday trading momentum at the positive or failed tests at the levels noted.
- Buying pressure intraday will likely strengthen with a bullish retest of 7079
- Selling pressure intraday will likely strengthen with a bearish retest of 7040
- Resistance sits near 7078.5 to 7104.5 with 7149.5 and 7202.5 above that.
- Support sits between 7051.5 and 7027.75, with 7007.75 and 6964.75 below that.
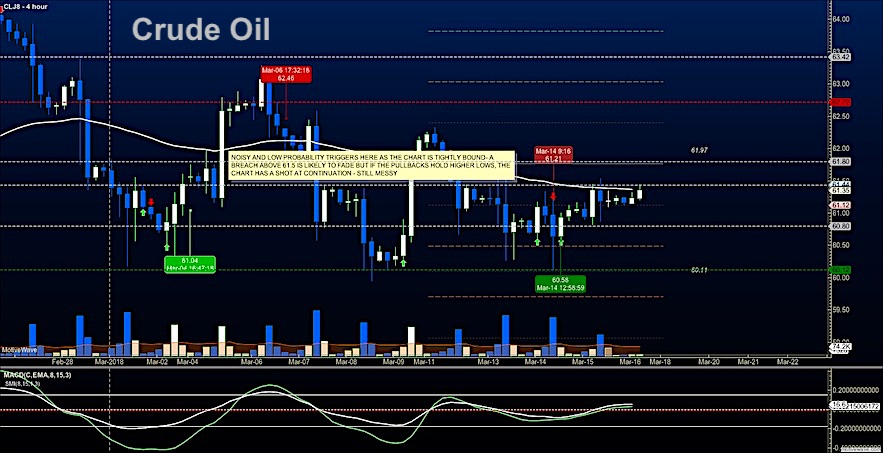
WTI Crude Oil
Ranges continue to compress as traders keep prices between 61 and 61.5 – prepare for the breach of this level above to fade back to congestion. Noisy trading will prevail as long as it holds between 61.12 and 61.56. The bullets below represent the likely shift of intraday trading momentum at the positive or failed tests at the levels noted.
- Buying pressure intraday will likely strengthen with a bullish retest of 61.56
- Selling pressure intraday will strengthen with a bearish retest of 61.08
- Resistance sits near 61.54 to 61.97, with 62.72 and 63.42 above that.
- Support holds near 61.12 to 60.46, with 60.12 and 59.56 below that.
Twitter: @AnneMarieTrades
The author trades stock market futures every day and may have a position in mentioned securities at the time of publication. Any opinions expressed herein are solely those of the author, and do not in any way represent the views or opinions of any other person or entity.


