Stock Market Futures Outlook for May 19, 2016 (S&P 500 futures) – The chart to battle 2038, but we’ve broken it enough times for buyers to be concerned about support levels holding.
Currently, we sit just below this level at the time of this writing. Deeper support sits below at 2032, and 2028.5. And further below here will bump into waiting buyers, but those positions seem weak relative to momentum right now. That means that bounces ought to be sold here today as the weight of sellers bears heavy of the market. The Fed release speak was significantly shifted to make the markets consider that an interest rate increase is still on the table for June. A disappearing airliner over the sea probably isn’t helping either.
For now, sellers have the floor with entries near old support – that 2038 number and perhaps 2041.5. If we are able to breach 2045.75, buyers are more apt to the retrace upward back into resistance near 2053-2055, before sellers try to force buyers back down again. Lots of overhead supply exists, and the charts continue to look heavy. That said, they are not cascading through support yet.
Momentum on the four-hour chart remains negative. That means continued negative trending behavior – but risk suggests that the trade off failed resistance will deliver better results. Key support action is now shifted down into 2019 with a line of buyers near 2027-2028.5. Drifts to deeper support appear to be on the horizon. This entire region, near 2033-2038, represents low probability trading intraday, as so many forces are in play and are struggling for strength.
See today’s economic calendar with a rundown of releases.
THE RANGE OF TUESDAY’S MOTION
E-mini S&P 500 Futures (ES_F)
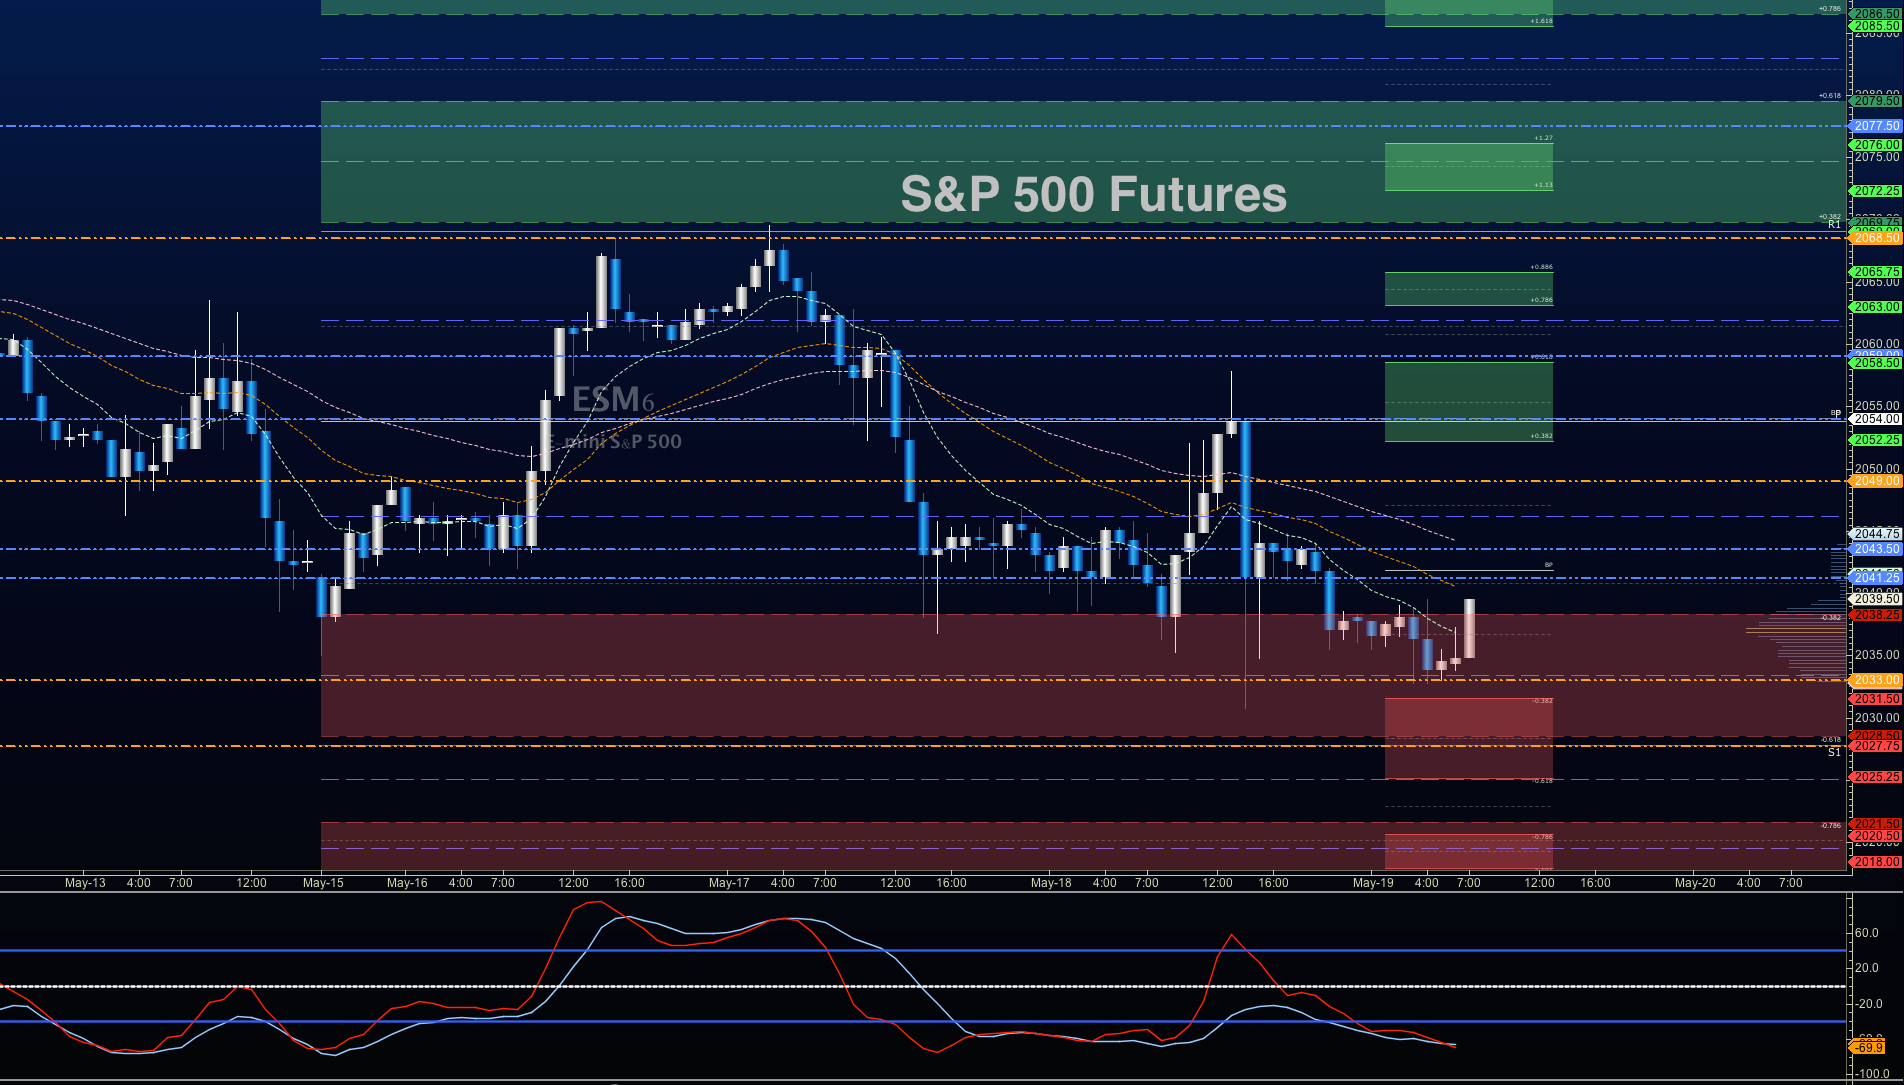
S&P 500 Futures Outlook for May 19, 2016 – Some negative trend continuation exists here at these lower congestion levels. Momentum sits with the sellers currently. Selling the bounces into resistance will deliver results, as always –keep an eye out for higher lows.
Upside trades on S&P 500 futures – Favorable setups sit on the positive retest of 2045.25, or a positive retest of 2038.25 with positive momentum (of which there is none, at present- ). I use the 30min to 1hr chart for the breach and retest mechanic. Targets from 2038.25 are 2041.25, 2043.5, 2045.25, 2046.75, 2052.5, 2055, and if we can catch a bid there, we could expand into 2057.5 and 2061.75.
Downside trades on S&P 500 futures – Favorable setups sit below the failed retest of 2034 or at the failed retest of 2038 with negative divergence. It is important to watch for higher lows to develop with the 2038 entry as much consolidation would sit below if that occurred. Retracement into lower levels from 2038 gives us the targets 2034.5, 2031.25, 2029.5, 2026.5, 2025.5, and perhaps even 2021.75, before bouncing.
Have a look at the Fibonacci levels across stock market futures on the blog for more targets.
Crude Oil Futures (CL_F)
Outlook for crude oil for May 19 – EIA report gave us a build, while the API gave is a weaker draw than expected. This grounded the upside motion for oil prices and the fall has continued overnight into a key support level here near 47.74. Sellers gradually piled on into the drifting price down, and today, I anticipate a bounce off the support levels between 47.45 and 47.75 into potentially lower highs. Next week’s API and EIA report still an important consideration as we sit at congestion.
The trading range for crude oil suggests support action near 47.4, and resistance behavior near 48.76.
Upside trades on crude oil can be staged on the positive retest of 47.75, or after a deep dip into 47.1, but carefully watch for a lower high to develop with that deep drift. I often use the 30min to 1hr chart for the breach and retest mechanic. Targets from 47.1 are 47.45, 47.75, 48.2, 48.4, 48.65, 48.8, 49.09, 49.34, 49.48, and if we can catch a bid there, we could expand into 49.78, and 50.03 to 50.92. Next week’s API report and EIA report may likely be affected by Nigeria disruption, and will certainly weigh on price action.
Downside trades on crude oil continue to setup well below failed retests – Today, I’m looking for the failed retest of 48.4, or at the range expansion into 49.24 with negative divergence – careful to watch for higher lows at the short on the resistance level. If the chart does not bounce off 47.75, we can stage a short on the failed retest there as well, but I do see a bounce staging from there. Retracement into lower levels from 49.24 give us the targets 49.08, 48.8, 48.67, 48.49, 48.36, 48.17, 47.76, 47.42, 47.26, and perhaps 47.04, 46.76, and 46.44.
If you’re interested in the live trading room, it is now primarily stock market futures content, though we do track heavily traded stocks and their likely daily trajectories as well – we begin at 9am with a morning report and likely chart movements along with trade setups for the day.
As long as the trader keeps himself aware of support and resistance levels, risk can be very adequately managed to play in either direction as bottom picking remains a behavior pattern that is developing with value buyers and speculative traders.
Twitter: @AnneMarieTrades
The author trades stock market futures every day and may have a position in mentioned securities at the time of publication. Any opinions expressed herein are solely those of the author, and do not in any way represent the views or opinions of any other person or entity.


