The Morning Report: Stock Market Futures In Bounce Formation Again
Earnings season continues– After holding sideways yesterday as China fell (futures on short schedule due to holiday), charts have held support. Failed resistance tests still seem likely ahead as S&P 500 futures prices bounce to test first 1911 then 1915, and 1926.25.
Intraday resistance sits near 1911.25. Intraday support sits at 1868.5 -(congestion sits at 1883.5). Breaks of either resistance or support must be retested on tighter time frames (30min/1hr) for trending trades on the day to hold. Bounces like the ones we are currently seeing on stock market futures should be sold near resistance. We have bearish momentum formations that are lifting on longer time frames, as we try to recapture old support now near 1915.
S&P 500 futures shorter time frame momentum indicators are positive, and higher than Friday. Longer cycles are downward trending and lifting somewhat in negative territory.
See today’s economic calendar with a rundown of releases.
THE RANGE OF TUESDAY’S MOTION
Crude Oil Futures (CL_F)
Crude Oil prices are bouncing again off its lows. Buyers are scrambling into position again in hopes that the charts will hold. I still suspect a bounce that carries to 32.62 or so, but so far we sit at highs near 31.07 or so (current resistance is around 31.29).
Trading ranges are between 29.86 and 31.27, with 30.4 being an important support level for Crude Oil to hold.
Moving averages in crude oil are still clearly negative on longer time frames but continue to be tested. Momentum is securely negative but continues to look divergent particularly on the 4 hour chart. If this chart is bottoming, we could chop around this region for a while
Intraday trade setup suggests a long off 30.4 retest (counter trend big picture but holding from an inflection perspective) into 30.78, 31.01, 31.24, 31.6, 31.89, and 32.24 to 32.62– see the blog for levels above that region. Below a 30.24 failed retest or a rejection of the 31.7 area sends us to 31.47, 31,23, 30.96, 30.65, 30.4, 29.78 and 29.44 perhaps as the next support space – Momentum on longer time frames is negative.
E-mini S&P 500 Futures (ES_F)
Below is a stock market futures chart with price support and resistance trading levels for the S&P 500. Click to enlarge.
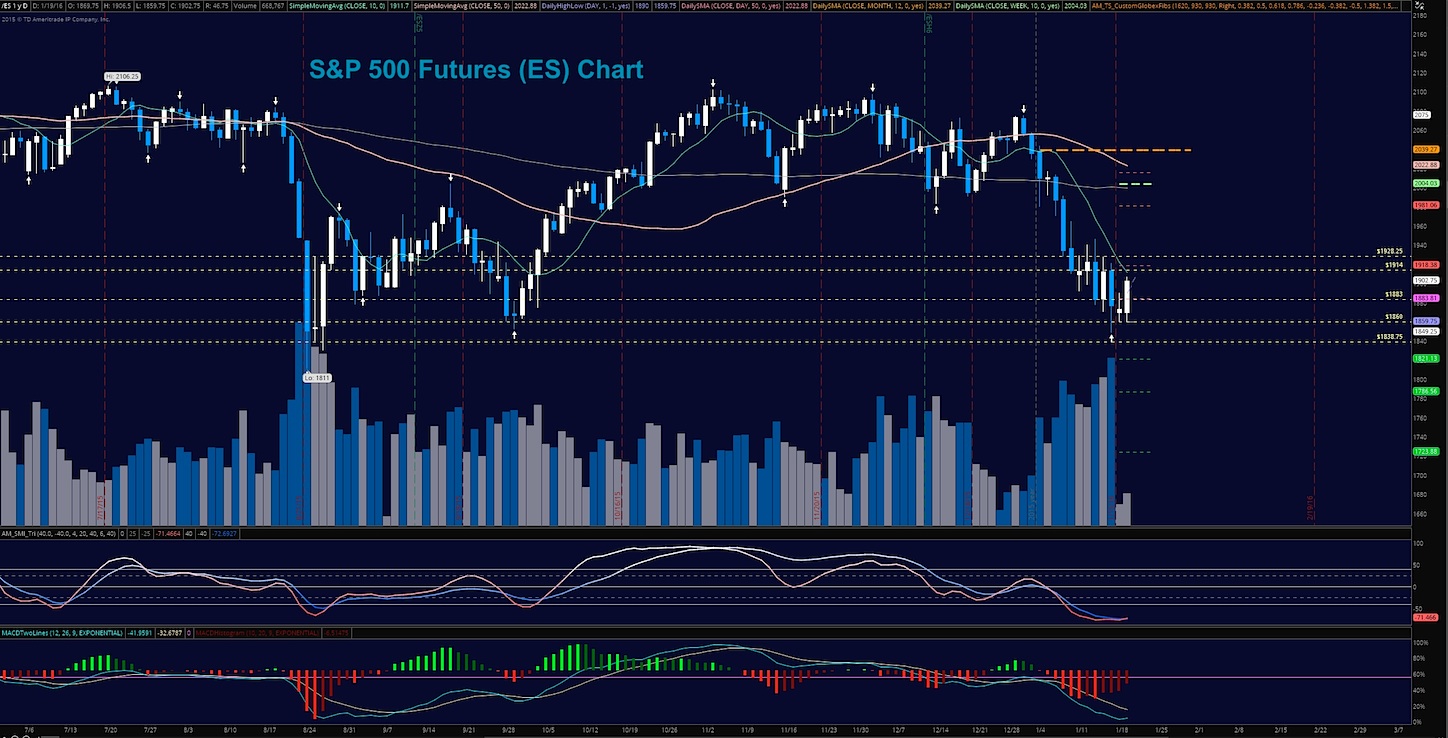
Chart holding steady above newer support at 1883 level- currently testing 1902. Primary support sits at 1868.5- bearish formations still give the chart seller strength. Upside motion has the best setup on the breach of and positive retest of 1890.5 – or a bounce off 1883.5 (as long as momentum shows this as likely to hold)- Targets from 1883 are 1886.75, 1890, 1896.25, 1899.25, 1902.5, 1905.75, 1909.25, and 1911. Big resistance test now at the region between 1911-1917.5 if the charts hold a bounce, so watch that area for sellers to try to reverse the trend of the bounce, if the chart continues north over 1905.75. Long trades are counter trend into resistance intraday at this writing.
Downside motion opens below the failed retest of 1882.25 or at the failure to hold 1921.75 bounce. Retracement into lower levels from 1921.5 gives us the targets at 1917.75, 1914.5, 1911.25, 1905.5, 1902.25, 1889.25, 1882.5, 1878.5, 1874.5, 1871.75, 1868.5, and perhaps 1860.75 once more. We are in a relief bounce.
Short action intraday is with the bigger trend (we are bouncing into resistance) currently unless we have a breach and positive retest of 1914.75 and positive momentum patterns.
If you’re interested in the live trading room, it is now primarily futures content, though we do track heavily traded stocks and their likely daily trajectories as well – we begin at 9am with a morning report and likely chart movements along with trade setups for the day.
As long as the trader keeps himself aware of support and resistance levels, risk can be very adequately managed to play in either direction as bottom picking remains a behavior pattern that is developing with value buyers and speculative traders. Visit The Trading Vault to learn how to trade the way I do. Thanks for reading.
Twitter: @AnneMarieTrades
The author trades stock market futures every day and may have a position in mentioned securities at the time of publication. Any opinions expressed herein are solely those of the author, and do not in any way represent the views or opinions of any other person or entity.

: Worrisome to Broader Market?")


