After the S&P 500 futures failed to hold a retest of 1931 yesterday, the charts opened the doors to selling and collapsed under the pressure. Stock market futures made lower lows and ended near the lows for the day. This was an unexpected event to me, but one that I was prepared for nevertheless.
As a trader, truly preparing for the unexpected mentally will keep you green most of the time.
Sellers are back in control of the S&P 500 futures chart as old support regions have now become new resistance. Failed resistance tests still seem likely ahead. Along with the jitters from yesterdays selloff, traders will have to contend with the noise of more earnings reports.
Intraday resistance for S&P 500 futures sits near 1898.25. Intraday support sits at 1874 -(midline sits at 1889.75). Breaks of either resistance or support must be retested on tighter time frames (30min/1hr) for trending trades on the day to hold. Stock market futures bounces like the ones we are seeing right now should be sold into resistance until proven otherwise. We have bearish intraday momentum formations that are flattening, as the S&P 500 futures attempt to recapture old support now near 1914.
Shorter time frame momentum indicators are negative, and lower than Wednesday. Longer cycles are downward trending and hold steady in negative territory.
See today’s economic calendar with a rundown of releases.
THE RANGE OF TUESDAY’S MOTION
Crude Oil Futures (CL_F)
Crude oil prices came close to retesting prior day’s lows before bouncing off familiar support around 30.14. Buyers scrambled into position again in hopes that the charts would hold. I still suspect a bounce that carries to 32.62 or so, but thus far the futures market has yet to break resistance at 31.74 or so. Charts are drifting in congested patterns and momentum is decidedly bearish.
Futures trading ranges are between 30.3 and 31, with 30.66 being an important support level to hold.
Moving averages in crude oil are still clearly negative on longer time frames but continue to be tested. Momentum is securely negative but continues to look divergent. If we are at an inflection point in the grand scheme, they are often quite difficult to trade on a swing (as we can see over the last few days) so use caution.
Intraday trade setups suggests a long off a breach and positive retest of 31 (counter trend big picture but holding from an inflection perspective) into 31.4, 31.6, 31.8, and 32.24 to 32.62– see the blog for levels above that region. Below a 30.6 failed retest or a rejection of the 31.7 area sends us to 31.47, 31,23, 30.96, 30.65, 30.4, and 29.78 perhaps as the next support space – Momentum on longer time frames is negative but lifting.
E-mini S&P 500 Futures (ES_F)
Below is a stock market futures chart with price support and resistance trading levels for the S&P 500. Click to enlarge.
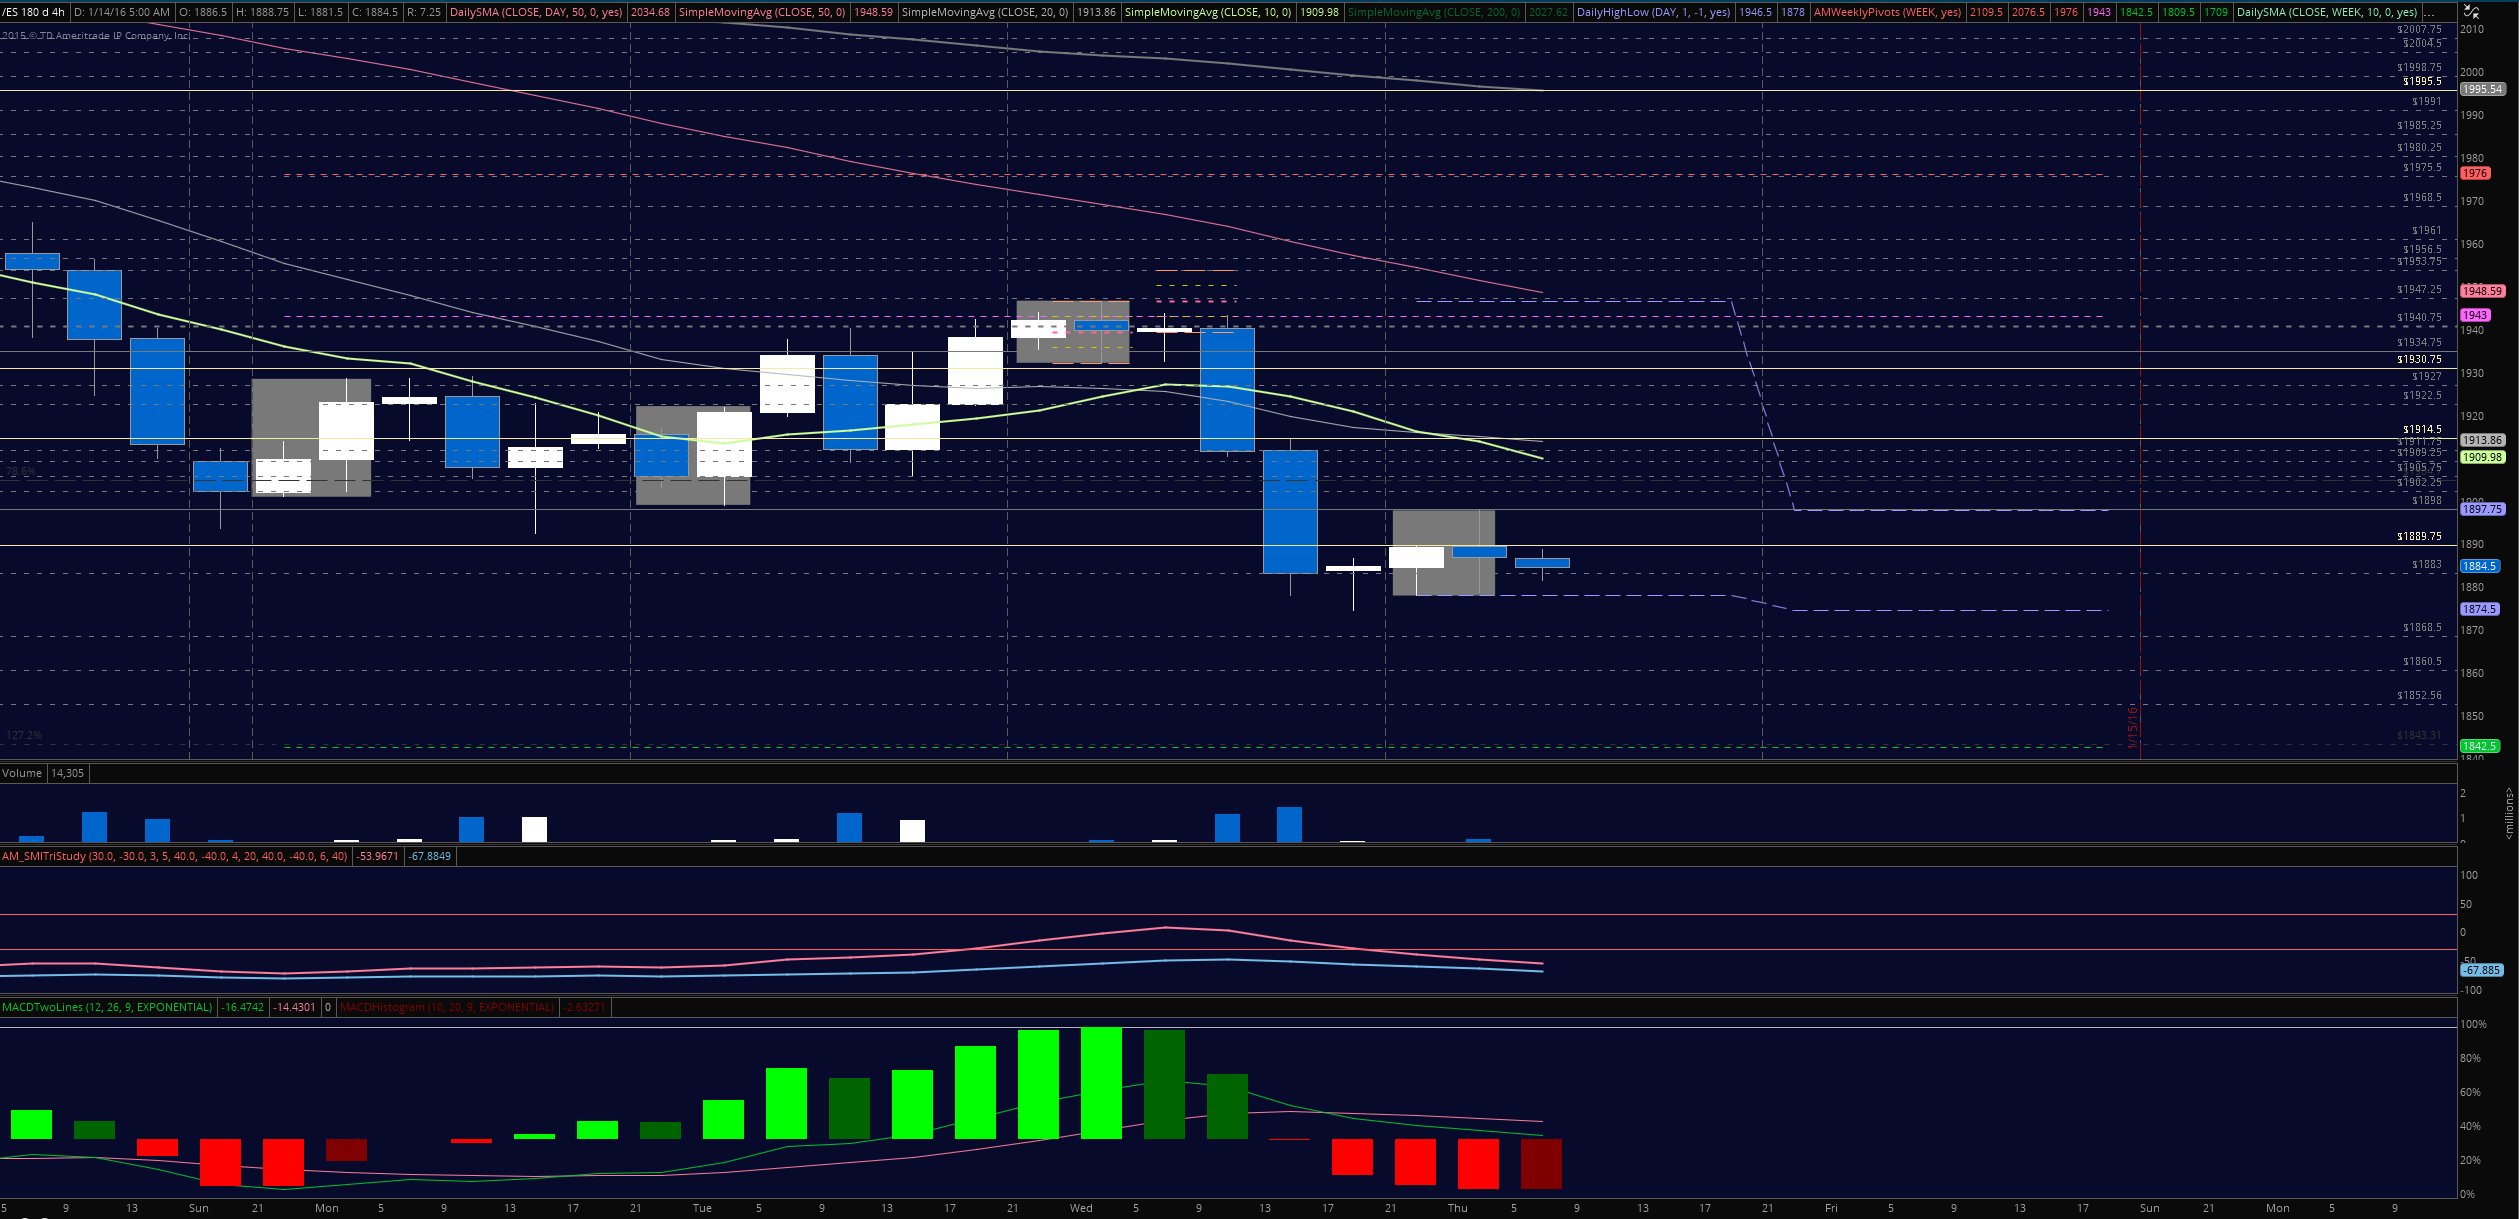
The chart of S&P 500 futures is holding steady above newer support around the 1883 level. Primary support sits at 1874.5. Upside motion has the best setup on the breach of and positive retest of 1889.75 – or a bounce off 1874.5 (as long as momentum shows this as likely to hold)- Targets from 1883, 1889, 1896.25, 1898, 1902.5 and 1905.75, 1909.25. S&P 500 futures face a big resistance test now at the region between 1911-1914.5 (if the charts hold a bounce), so watch that area for sellers to try to reverse the trend of the bounce if the chart continues north over 1905.75. Long trades are counter trending intraday at this writing.
Downside motion opens below the failed retest of 1878.25 or at the failure to hold 1897.75 bounce. Retracement into lower levels from 1889.5 gives us the targets at 1883.25, 1878.5, 1874.5, 1871.75, 1868.5, and perhaps 1860.75.
Short action intraday is trending currently unless we have a bounce and positive retest of 1897.75 and positive momentum patterns.
If you’re interested in the live trading room, it is now primarily stock market futures content, though we do track heavily traded stocks and their likely daily trajectories as well – we begin at 9am with a morning report and likely chart movements along with trade setups for the day.
As long as the trader keeps himself aware of support and resistance levels, risk can be very adequately managed to play in either direction as bottom picking remains a behavior pattern that is developing with value buyers and speculative traders.
Twitter: @AnneMarieTrades
The author trades stock market futures every day and may have a position in mentioned securities at the time of publication. Any opinions expressed herein are solely those of the author, and do not in any way represent the views or opinions of any other person or entity.


: Showing Some Signs of Emerging Strength")
